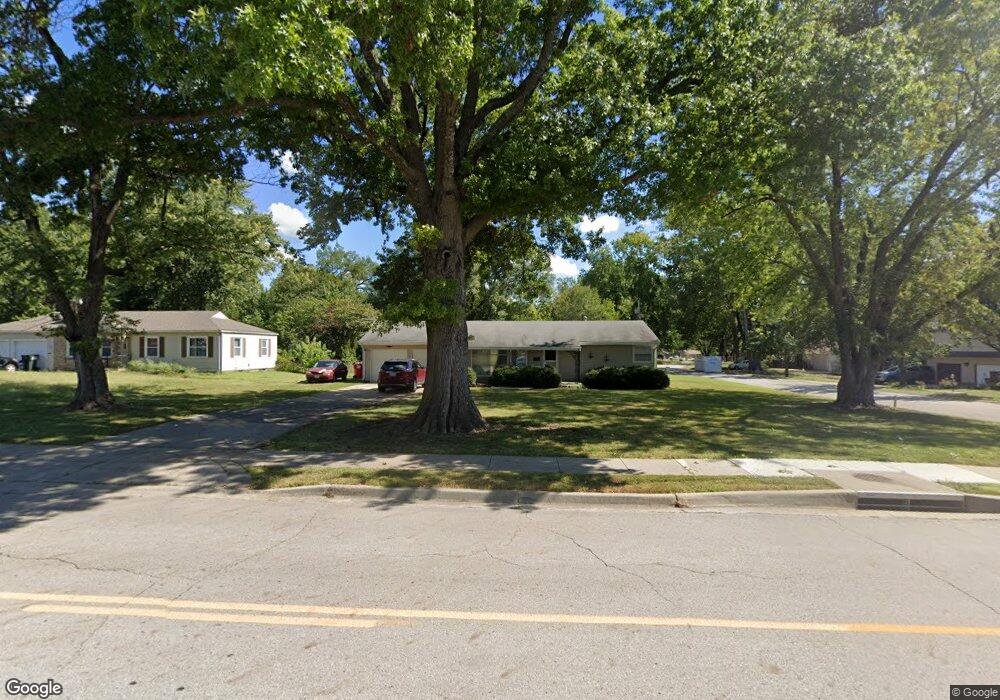
13715 Botts Rd Grandview, MO 64030
Estimated Value: $170,000 - $198,000
3
Beds
1
Bath
984
Sq Ft
$182/Sq Ft
Est. Value
About This Home
This home is located at 13715 Botts Rd, Grandview, MO 64030 and is currently estimated at $179,576, approximately $182 per square foot. 13715 Botts Rd is a home located in Jackson County with nearby schools including Butcher-Greene Elementary School, Grandview Middle, and Grandview High School.
Ownership History
Date
Name
Owned For
Owner Type
Purchase Details
Closed on
Aug 12, 2015
Sold by
Sisk Kevin W
Bought by
Gill Daniel Joseph and Hackling Patricia G
Current Estimated Value
Home Financials for this Owner
Home Financials are based on the most recent Mortgage that was taken out on this home.
Original Mortgage
$48,750
Interest Rate
4.13%
Mortgage Type
New Conventional
Purchase Details
Closed on
Jul 17, 2015
Sold by
Drake Kelly S and Drake Scott
Bought by
Sisk Kevin W
Home Financials for this Owner
Home Financials are based on the most recent Mortgage that was taken out on this home.
Original Mortgage
$48,750
Interest Rate
4.13%
Mortgage Type
New Conventional
Purchase Details
Closed on
Mar 4, 2003
Sold by
Stump Helen K
Bought by
Sisk Kenneth M and Sisk Patricia A
Create a Home Valuation Report for This Property
The Home Valuation Report is an in-depth analysis detailing your home's value as well as a comparison with similar homes in the area
Home Values in the Area
Average Home Value in this Area
Purchase History
| Date | Buyer | Sale Price | Title Company |
|---|---|---|---|
| Gill Daniel Joseph | -- | None Available | |
| Sisk Kevin W | -- | None Available | |
| Sisk Kenneth M | -- | Security Land Title Company |
Source: Public Records
Mortgage History
| Date | Status | Borrower | Loan Amount |
|---|---|---|---|
| Closed | Gill Daniel Joseph | $48,750 |
Source: Public Records
Tax History Compared to Growth
Tax History
| Year | Tax Paid | Tax Assessment Tax Assessment Total Assessment is a certain percentage of the fair market value that is determined by local assessors to be the total taxable value of land and additions on the property. | Land | Improvement |
|---|---|---|---|---|
| 2025 | $1,974 | $23,117 | $7,100 | $16,017 |
| 2024 | $1,974 | $24,276 | $5,955 | $18,321 |
| 2023 | $1,940 | $24,277 | $2,423 | $21,854 |
| 2022 | $1,501 | $17,480 | $2,906 | $14,574 |
| 2021 | $1,499 | $17,480 | $2,906 | $14,574 |
| 2020 | $1,270 | $15,686 | $2,906 | $12,780 |
| 2019 | $1,225 | $15,686 | $2,906 | $12,780 |
| 2018 | $1,146 | $13,652 | $2,529 | $11,123 |
| 2017 | $1,141 | $13,652 | $2,529 | $11,123 |
| 2016 | $1,141 | $13,309 | $2,469 | $10,840 |
| 2014 | $1,134 | $13,049 | $2,421 | $10,628 |
Source: Public Records
Map
Nearby Homes
- 13608 Spruce Ave
- 13609 Spruce Ave
- 13608 Cypress Ave
- 13606 Cypress Ave
- 13609 Cypress Ave
- 13520 Cypress Ave
- 13504 Spruce Ave
- 4411 E 135th St
- 13808 Norby Rd
- 4718 E 135th Ct
- 13901 Grandboro Ln
- 13516 12th St
- 13120 4th St
- 13301 10th St
- 807 Highgrove Rd
- 709 Rhodes Ave
- 1402 Goode Ave
- 14051 Dunbar Ct
- 14925 S U S 71 Hwy
- 14020 Dunoon St
- 13711 Botts Rd
- 13801 Botts Rd
- 13709 Botts Rd
- 13805 Botts Rd
- 4209 E 138th St
- 13718 Spruce Ave
- 13705 Botts Rd
- 13809 Botts Rd
- 4301 E 138th St
- 13710 Spruce Ave
- 13701 Botts Rd
- 13811 Botts Rd
- 4305 E 138th St
- 4304 E 138th St
- 13715 Spruce Ave
- 13706 Spruce Ave
- 13611 Botts Rd
- 13815 Botts Rd
- 13700 Spruce Ave
- 4309 E 138th St