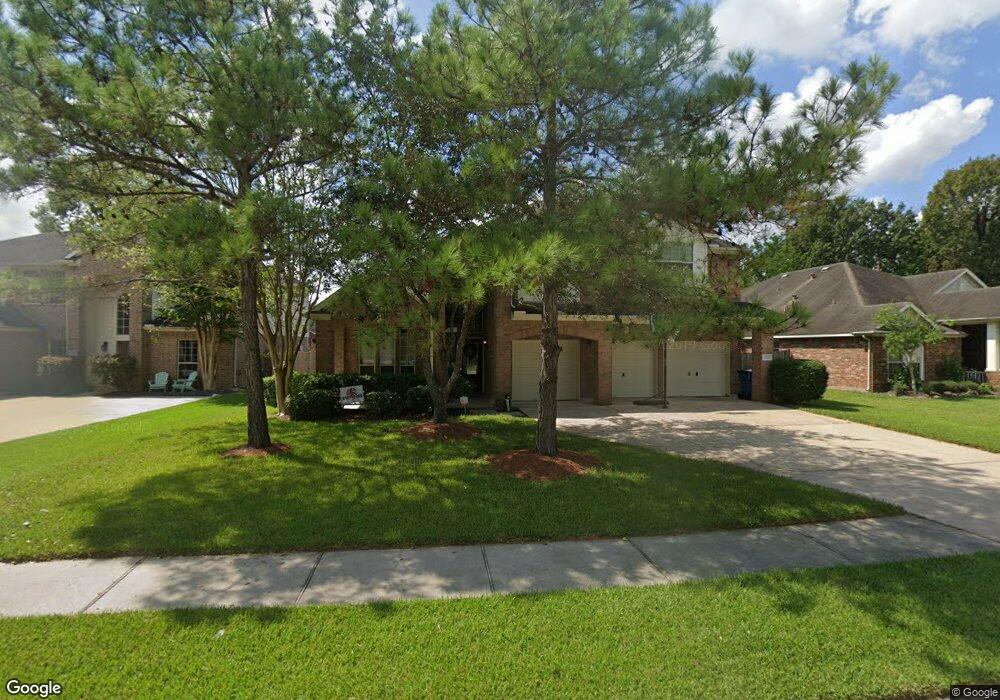
13715 Brighton Park Dr Houston, TX 77044
Summerwood NeighborhoodEstimated Value: $369,000 - $388,688
4
Beds
3
Baths
2,773
Sq Ft
$136/Sq Ft
Est. Value
About This Home
This home is located at 13715 Brighton Park Dr, Houston, TX 77044 and is currently estimated at $376,172, approximately $135 per square foot. 13715 Brighton Park Dr is a home located in Harris County with nearby schools including Summerwood Elementary School, Woodcreek Middle, and Summer Creek High School.
Ownership History
Date
Name
Owned For
Owner Type
Purchase Details
Closed on
Jul 5, 2012
Sold by
Sandlin Joe S and Sandlin Susan M
Bought by
Andrews Jennifer Z
Current Estimated Value
Home Financials for this Owner
Home Financials are based on the most recent Mortgage that was taken out on this home.
Original Mortgage
$190,387
Outstanding Balance
$131,918
Interest Rate
3.75%
Mortgage Type
FHA
Estimated Equity
$244,254
Purchase Details
Closed on
Aug 18, 2004
Sold by
Legacy/Monterey Homes Lp
Bought by
Sandlin Joe S and Sandlin Susan M
Home Financials for this Owner
Home Financials are based on the most recent Mortgage that was taken out on this home.
Original Mortgage
$155,992
Interest Rate
5%
Mortgage Type
Purchase Money Mortgage
Purchase Details
Closed on
Dec 4, 2003
Sold by
Genstar Summerwood Lp
Bought by
Legacy/Monterey Homes Lp
Create a Home Valuation Report for This Property
The Home Valuation Report is an in-depth analysis detailing your home's value as well as a comparison with similar homes in the area
Home Values in the Area
Average Home Value in this Area
Purchase History
| Date | Buyer | Sale Price | Title Company |
|---|---|---|---|
| Andrews Jennifer Z | -- | Capital Title | |
| Sandlin Joe S | -- | Mth Title Company | |
| Legacy/Monterey Homes Lp | -- | Mth Title Company |
Source: Public Records
Mortgage History
| Date | Status | Borrower | Loan Amount |
|---|---|---|---|
| Open | Andrews Jennifer Z | $190,387 | |
| Previous Owner | Sandlin Joe S | $155,992 | |
| Closed | Sandlin Joe S | $29,248 |
Source: Public Records
Tax History Compared to Growth
Tax History
| Year | Tax Paid | Tax Assessment Tax Assessment Total Assessment is a certain percentage of the fair market value that is determined by local assessors to be the total taxable value of land and additions on the property. | Land | Improvement |
|---|---|---|---|---|
| 2025 | $6,625 | $370,019 | $75,877 | $294,142 |
| 2024 | $6,625 | $368,081 | $75,877 | $292,204 |
| 2023 | $6,625 | $391,939 | $43,929 | $348,010 |
| 2022 | $7,683 | $336,854 | $43,929 | $292,925 |
| 2021 | $7,338 | $285,665 | $43,929 | $241,736 |
| 2020 | $7,183 | $244,096 | $43,929 | $200,167 |
| 2019 | $7,808 | $254,925 | $27,097 | $227,828 |
| 2018 | $3,439 | $251,247 | $27,097 | $224,150 |
| 2017 | $7,947 | $251,247 | $27,097 | $224,150 |
| 2016 | $7,672 | $242,558 | $27,097 | $215,461 |
| 2015 | $4,901 | $242,558 | $27,097 | $215,461 |
| 2014 | $4,901 | $207,671 | $27,097 | $180,574 |
Source: Public Records
Map
Nearby Homes
- 13614 Heath Spring Ct
- 13714 Brighton Park Dr
- 13522 Summer Villa Ln
- 13426 Summer Villa Ln
- 13610 Popes Creek Ln
- 14402 Cottage Timbers Ln
- 15606 Marble Canyon Way
- 14418 Country Haven Ct
- 15614 Stone Gables Ln
- 15015 Cozy Hollow Ln
- 15019 Cozy Hollow Ln
- 15718 Starcreek Ln
- 15806 Elkins Creek Ct
- 14706 Castle Cove Ln
- 14710 Castle Cove Ln
- 14415 Red Mulberry Ln
- 14406 Morning Lodge Ln
- 14322 Stonebury Trail Ln
- 13723 Greenwood Ln S
- 14510 Southern Magnolia Cir
- 13711 Brighton Park Dr
- 13719 Brighton Park Dr
- 13630 Heath Spring Ct
- 13707 Brighton Park Dr
- 13634 Heath Spring Ct
- 13626 Heath Spring Ct
- 13718 Brighton Park Dr
- 13703 Brighton Park Dr
- 13622 Heath Spring Ct
- 13710 Brighton Park Dr
- 13803 Brighton Park Dr
- 13802 Brighton Park Dr
- 13706 Brighton Park Dr
- 13802 Oxham Falls Ct
- 15014 Misty Stone Ct
- 13618 Heath Spring Ct
- 13623 Brighton Park Dr
- 13807 Brighton Park Dr
- 15010 Misty Stone Ct
- 13806 Oxham Falls Ct