NOT LISTED FOR SALE

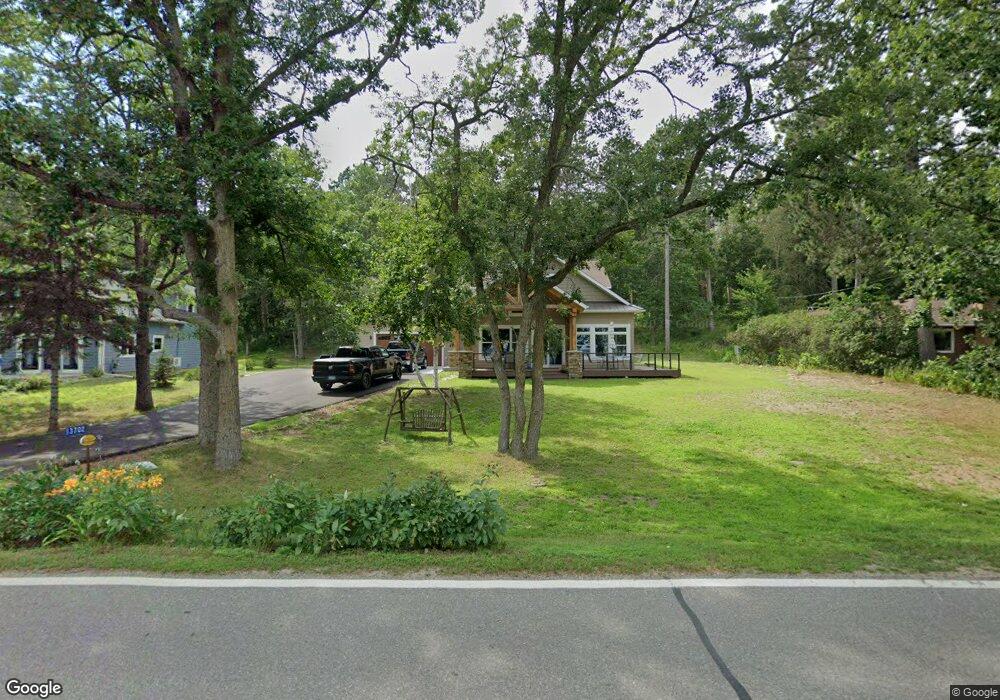
13716 County 18 Park Rapids, MN 56470

Estimated Value: $484,926 - $626,000

4 Beds
3 Baths
2,240 Sq Ft
$252/Sq Ft Est. Value

About This Home

This home is located at 13716 County 18, Park Rapids, MN 56470 and is currently estimated at $565,232, approximately $252 per square foot. 13716 County 18 is a home located in Hubbard County with nearby schools including Century Elementary School, Century School, and Park Rapids Area High School.

Ownership History

Date Name Owned For Owner Type

Purchase Details

Closed on
Jan 14, 2026
Sold by
Buck Jeffrey and Buck Shirley M
Bought by
Buck Dylan and Buck Cullen J
Current Estimated Value
$565,232

Purchase Details

Closed on
May 5, 2023
Sold by
Schmidt Delan and Schmidt Kathryn R
Bought by
Buck Jeffrey and Buck Shirley M

Home Financials for this Owner

Home Financials are based on the most recent Mortgage that was taken out on this home.
Original Mortgage
$365,000
Interest Rate
6.42%
Mortgage Type
New Conventional

Purchase Details

Closed on
Nov 20, 2020
Sold by
Peterson Helen B
Bought by
Schmidt Delan G and Schmidt Kathryn R
Source: Public Records

Range of Values:

--
Value Increase
--
Percent Increase
--
Adjusted for Inflation
Collateral Analytics

Collateral Analytics Collateral Analytics AVMs (Automated Valuation Model) employ a number of statistical approaches combined with neighborhood-specific comparable selection guarantees the most up-to-date and precise valuations.

Not Available

Collateral Analytics does not have data for the current month. Please view the chart for historical values.

ICE

ICE Mortgage Technology ICE Mortgage Technology’s AVM (Automated Valuation Model) is a state-of-the-art online residential property valuation tool that provides a quick and accurate estimate of the value of almost any home in the U.S.

Not Available

ICE Mortgage Technology does not have data for the current month. Please view the chart for historical values.

First American

First American First American Data & Analytics’ next-generation AVM combines unrivaled data assets with a blended ensemble of valuation models to produce highly accurate, reliable valuations you can trust.

Not Available

First American does not have data for the current month. Please view the chart for historical values.

Quantarium

Quantarium Quantarium’s valuation service, repeatedly proven the industry’s most accurate and comprehensive, is supercharged with a self-learning and auto-tuning AI engine that continually becomes smarter and more accurate as it processes daily inputs from the industry’s leading RE data lake.

Not Available

Quantarium does not have data for the current month. Please view the chart for historical values.

Average Value
Not Available
List Price
Sold Price
Create a Home Valuation Report for This Property
The Home Valuation Report is an in-depth analysis detailing your home's value as well as a comparison with similar homes in the area

Home Values in the Area

Source: Public Records

Average Home Value in this Area


Source: Public Records

Purchase History

We collect this data history from publicly available records. To have your information removed, we recommend requesting removal directly through your county’s website.

Date Buyer Sale Price Title Company
Buck Dylan $500 None Listed On Document
Buck Jeffrey $480,000 None Listed On Document
Schmidt Delan G $320,000 None Available
Schmidt Delan Delan $320,000 --
Source: Public Records

Mortgage History

We collect this data history from publicly available records. To have your information removed, we recommend requesting removal directly through your county’s website.

Date Status Borrower Loan Amount
Previous Owner Buck Jeffrey $365,000
Source: Public Records

Tax History

Year Tax Paid Tax Assessment Tax Assessment Total Assessment is a certain percentage of the fair market value that is determined by local assessors to be the total taxable value of land and additions on the property. Land Improvement
2024 $3,008 $443,000 $129,000 $314,000
2023 $3,578 $511,800 $125,900 $385,900
2022 $2,628 $389,000 $110,500 $278,500
2021 $2,364 $279,500 $89,200 $190,300
2020 $2,420 $265,100 $85,245 $179,855
2019 $2,296 $262,800 $85,150 $177,650
2018 $2,178 $221,900 $73,469 $148,431
2016 $2,416 $219,900 $87,718 $132,182
2015 $2,018 $228,400 $92,972 $135,428
2014 $2,060 $233,500 $103,214 $130,286
Source: Public Records

Map

Your Personal Tour Guide

Ask me questions while you tour the home.