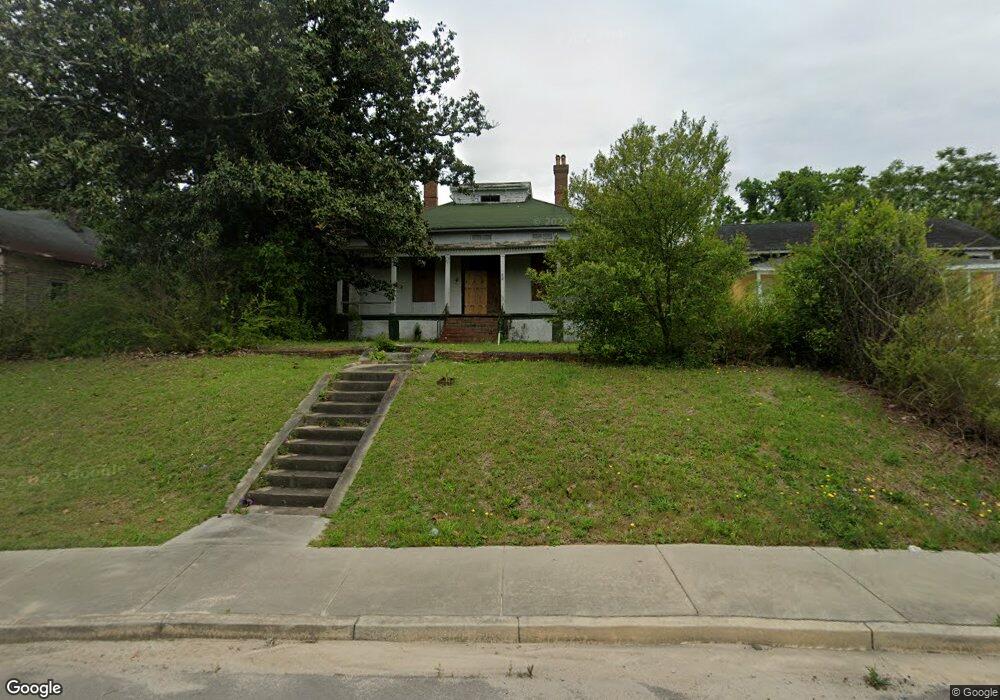
1372 2nd St Macon, GA 31201
Tindall Heights Historic District NeighborhoodEstimated Value: $48,367 - $203,000
Studio
1
Bath
2,507
Sq Ft
$39/Sq Ft
Est. Value
About This Home
This home is located at 1372 2nd St, Macon, GA 31201 and is currently estimated at $96,842, approximately $38 per square foot. 1372 2nd St is a home located in Bibb County with nearby schools including Ingram-Pye Elementary School, Central High School, and Cirrus Charter Academy.
Ownership History
Date
Name
Owned For
Owner Type
Purchase Details
Closed on
May 22, 2024
Sold by
Historic Macon Fading Five Llc
Bought by
Mcdonald Francis
Current Estimated Value
Purchase Details
Closed on
Sep 16, 2019
Sold by
Macon Bibb County Land Bank Authority
Bought by
Historic Macon Fading Five Llc
Purchase Details
Closed on
Jul 9, 2019
Sold by
County Of Bibb
Bought by
Macon Bibb County Land Bank Authority
Purchase Details
Closed on
Jan 28, 2008
Sold by
King Estella Murray
Bought by
Vital Samantha
Create a Home Valuation Report for This Property
The Home Valuation Report is an in-depth analysis detailing your home's value as well as a comparison with similar homes in the area
Home Values in the Area
Average Home Value in this Area
Purchase History
| Date | Buyer | Sale Price | Title Company |
|---|---|---|---|
| Mcdonald Francis | $13,500 | None Listed On Document | |
| Historic Macon Fading Five Llc | $2,700 | None Available | |
| Macon Bibb County Land Bank Authority | $13,744 | None Available | |
| Vital Samantha | $25,000 | None Available |
Source: Public Records
Tax History
| Year | Tax Paid | Tax Assessment Tax Assessment Total Assessment is a certain percentage of the fair market value that is determined by local assessors to be the total taxable value of land and additions on the property. | Land | Improvement |
|---|---|---|---|---|
| 2025 | $329 | $13,369 | $3,680 | $9,689 |
| 2024 | $342 | $13,481 | $3,792 | $9,689 |
| 2023 | $367 | $12,383 | $3,575 | $8,808 |
| 2022 | $1,365 | $9,611 | $2,513 | $7,098 |
| 2021 | $365 | $9,611 | $2,513 | $7,098 |
| 2020 | $373 | $9,611 | $2,513 | $7,098 |
| 2019 | $1,165 | $29,760 | $2,513 | $27,247 |
| 2018 | $1,964 | $29,760 | $2,513 | $27,247 |
| 2017 | $1,115 | $29,760 | $2,513 | $27,247 |
| 2016 | $1,030 | $29,760 | $2,513 | $27,247 |
| 2015 | $1,457 | $29,760 | $2,513 | $27,247 |
| 2014 | $1,676 | $29,760 | $2,513 | $27,247 |
Source: Public Records
Map
Nearby Homes
- 1405 2nd St
- 1425 3rd St
- 1470 2nd St
- 510 Edgewood Ave
- 553 & 565 Edgewood Ave
- 553 Edgewood Ave
- 1083 Elm St
- 1590 Telfair St
- 791 Liberty St
- 1048 Mckenna Ave
- 745 Pebble St
- 1278 Jackson St
- 1335 Jackson St
- 1471 Jackson St
- 980 Highland Terrace
- 356 Stratton St
- 1029 Ash St
- 727 S Williams St
- 940 Cole St
- 1034 Hazel St
Your Personal Tour Guide
Ask me questions while you tour the home.