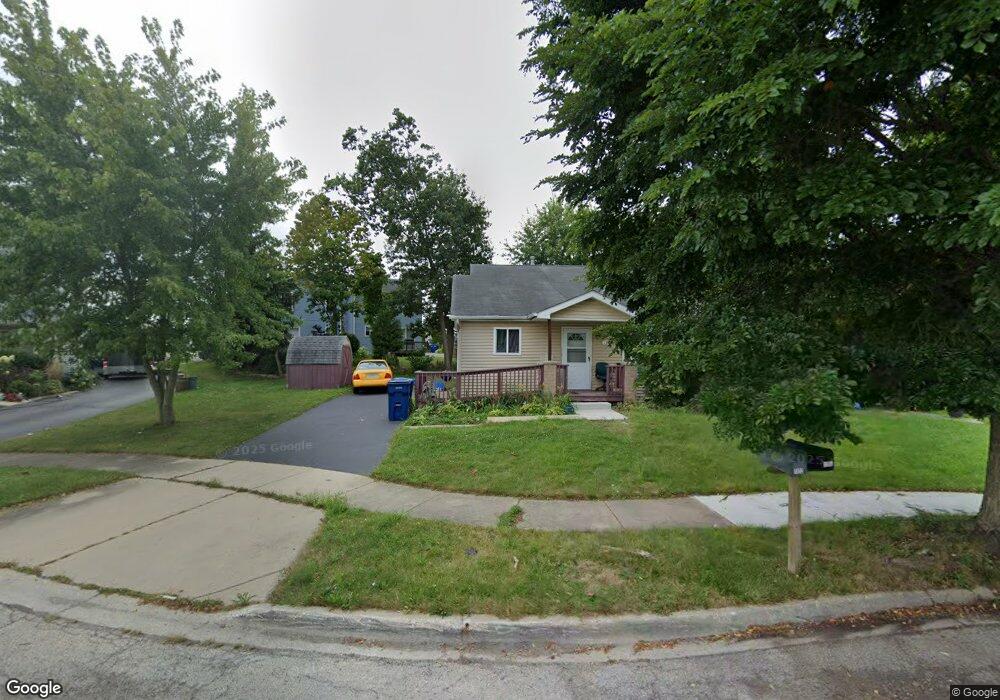
1372 Carter Ct Waukegan, IL 60085
Estimated Value: $189,000 - $240,997
2
Beds
2
Baths
1,024
Sq Ft
$211/Sq Ft
Est. Value
About This Home
This home is located at 1372 Carter Ct, Waukegan, IL 60085 and is currently estimated at $216,499, approximately $211 per square foot. 1372 Carter Ct is a home located in Lake County with nearby schools including Clearview Elementary School, John R Lewis Middle School, and Waukegan High School.
Ownership History
Date
Name
Owned For
Owner Type
Purchase Details
Closed on
May 14, 2011
Sold by
Habitat For Humanity Lake County Illinoi
Bought by
Quezada Maclovio
Current Estimated Value
Home Financials for this Owner
Home Financials are based on the most recent Mortgage that was taken out on this home.
Original Mortgage
$71,606
Interest Rate
4.08%
Mortgage Type
Seller Take Back
Purchase Details
Closed on
Nov 1, 2010
Sold by
Goodrode Dennis J and Goodrode Grace R
Bought by
Habitat For Humanity Lake County Illinoi
Purchase Details
Closed on
Oct 1, 2005
Sold by
Habitat For Humanity Lake County Il Inc
Bought by
Goodrode Dennis J and Goodrode Grace R
Home Financials for this Owner
Home Financials are based on the most recent Mortgage that was taken out on this home.
Original Mortgage
$72,608
Interest Rate
5.8%
Mortgage Type
Seller Take Back
Create a Home Valuation Report for This Property
The Home Valuation Report is an in-depth analysis detailing your home's value as well as a comparison with similar homes in the area
Home Values in the Area
Average Home Value in this Area
Purchase History
| Date | Buyer | Sale Price | Title Company |
|---|---|---|---|
| Quezada Maclovio | -- | North American Title Co | |
| Habitat For Humanity Lake County Illinoi | -- | None Available | |
| Goodrode Dennis J | -- | -- |
Source: Public Records
Mortgage History
| Date | Status | Borrower | Loan Amount |
|---|---|---|---|
| Previous Owner | Quezada Maclovio | $71,606 | |
| Previous Owner | Goodrode Dennis J | $72,608 |
Source: Public Records
Tax History Compared to Growth
Tax History
| Year | Tax Paid | Tax Assessment Tax Assessment Total Assessment is a certain percentage of the fair market value that is determined by local assessors to be the total taxable value of land and additions on the property. | Land | Improvement |
|---|---|---|---|---|
| 2024 | $4,609 | $64,096 | $15,523 | $48,573 |
| 2023 | $4,013 | $57,806 | $14,000 | $43,806 |
| 2022 | $4,013 | $47,604 | $5,395 | $42,209 |
| 2021 | $4,223 | $47,189 | $5,348 | $41,841 |
| 2020 | $4,233 | $43,962 | $4,982 | $38,980 |
| 2019 | $4,209 | $40,284 | $4,565 | $35,719 |
| 2018 | $3,579 | $34,406 | $5,288 | $29,118 |
| 2017 | $3,430 | $30,439 | $4,678 | $25,761 |
| 2016 | $3,121 | $26,450 | $4,065 | $22,385 |
| 2015 | $2,913 | $23,673 | $3,638 | $20,035 |
| 2014 | $3,985 | $29,456 | $3,120 | $26,336 |
| 2012 | $3,255 | $31,913 | $3,381 | $28,532 |
Source: Public Records
Map
Nearby Homes
- 3139 Casimer Pulaski Dr
- 1709 13th St
- 1712 11th St
- 1511 14th St
- 1927 Dugdale Rd
- 1617 Grove Ave
- 3027 Argonne Dr
- 2812 20th St
- 2413 20th St
- 1815 Hervey Ave
- 819 S Fulton Ave
- 1535 Glenn Dr
- 3045 20th Place
- 1022 S Elmwood Ave
- 0 Casimer Pulaski Dr Unit MRD12490157
- 1244 Victoria Ave
- 200 S Green Bay Rd
- 3159 Jeanette Ave
- 3188 Patricia Ln
- 3027 Belvidere Rd
- 1368 Carter Ct
- 1376 Carter Ct
- 2352 14th St
- 2356 14th St
- 2360 14th St
- 1380 Carter Ct
- 1364 Carter Ct
- 1384 Carter Ct
- 2364 14th St
- 1383 Carter Ct
- 1360 Carter Ct
- 1379 Carter Ct
- 1388 Carter Ct
- 2543 W Dugdale Rd
- 2527 W Dugdale Rd
- 2525 W Dugdale Rd
- 2525 W Dugdale Rd Unit 2525
- 2535 W Dugdale Rd
- 1392 Carter Ct
- 1391 Carter Ct