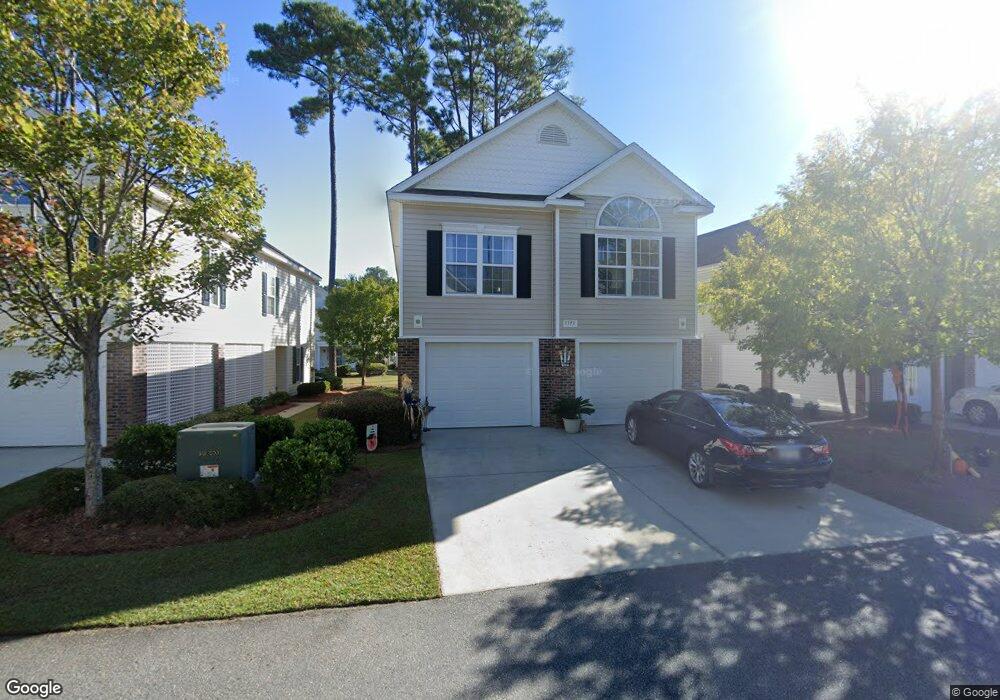
1372 Cottage Dr Unit 1372 Cottage Drive Myrtle Beach, SC 29577
Market Commons NeighborhoodEstimated Value: $342,000 - $362,777
4
Beds
3
Baths
1,554
Sq Ft
$227/Sq Ft
Est. Value
About This Home
This home is located at 1372 Cottage Dr Unit 1372 Cottage Drive, Myrtle Beach, SC 29577 and is currently estimated at $352,444, approximately $226 per square foot. 1372 Cottage Dr Unit 1372 Cottage Drive is a home located in Horry County with nearby schools including Myrtle Beach Child Development Center, Myrtle Beach Primary School, and Myrtle Beach Elementary School.
Ownership History
Date
Name
Owned For
Owner Type
Purchase Details
Closed on
Sep 26, 2024
Sold by
Johnston Margaret G
Bought by
Coffey Shannon Lynn and Anderson Donna Herzberg
Current Estimated Value
Home Financials for this Owner
Home Financials are based on the most recent Mortgage that was taken out on this home.
Original Mortgage
$241,500
Outstanding Balance
$238,961
Interest Rate
6.35%
Mortgage Type
New Conventional
Estimated Equity
$113,483
Purchase Details
Closed on
Jan 29, 2015
Sold by
Calloway Stephen M
Bought by
Johnston James J
Purchase Details
Closed on
Apr 26, 2007
Sold by
Springfield Development Group Llc
Bought by
Calloway Stephen M
Home Financials for this Owner
Home Financials are based on the most recent Mortgage that was taken out on this home.
Original Mortgage
$217,508
Interest Rate
6.25%
Mortgage Type
Purchase Money Mortgage
Create a Home Valuation Report for This Property
The Home Valuation Report is an in-depth analysis detailing your home's value as well as a comparison with similar homes in the area
Home Values in the Area
Average Home Value in this Area
Purchase History
| Date | Buyer | Sale Price | Title Company |
|---|---|---|---|
| Coffey Shannon Lynn | $345,000 | -- | |
| Johnston James J | $195,000 | -- | |
| Calloway Stephen M | $271,885 | None Available |
Source: Public Records
Mortgage History
| Date | Status | Borrower | Loan Amount |
|---|---|---|---|
| Open | Coffey Shannon Lynn | $241,500 | |
| Previous Owner | Calloway Stephen M | $217,508 |
Source: Public Records
Tax History Compared to Growth
Tax History
| Year | Tax Paid | Tax Assessment Tax Assessment Total Assessment is a certain percentage of the fair market value that is determined by local assessors to be the total taxable value of land and additions on the property. | Land | Improvement |
|---|---|---|---|---|
| 2024 | -- | $14,996 | $0 | $14,996 |
| 2023 | $0 | $13,806 | $0 | $13,806 |
| 2021 | $3,637 | $13,806 | $0 | $13,806 |
| 2020 | $3,469 | $13,806 | $0 | $13,806 |
| 2019 | $3,469 | $13,806 | $0 | $13,806 |
| 2018 | $3,112 | $11,700 | $0 | $11,700 |
| 2017 | $3,077 | $11,700 | $0 | $11,700 |
| 2016 | -- | $11,700 | $0 | $11,700 |
| 2015 | $2,961 | $11,388 | $0 | $11,388 |
| 2014 | $2,879 | $11,388 | $0 | $11,388 |
Source: Public Records
Map
Nearby Homes
- 1415 Powhaton Dr Unit 56
- 1423 Powhaton Dr Unit 69
- 1450 Powhaton Dr Unit 87
- 1662 Westminster Dr
- 1750 Cart Ln
- TBD Farrow Pkwy Unit At Market Common
- 821 Rebecca Ln Unit 6C
- 821 Rebecca Ln Unit 6D
- 821 Rebecca Ln Unit 6A
- 821 Rebecca Ln Unit 6B
- 1572 Thornbury Dr
- 780 Maxine Ct Unit 8A
- 780 Maxine Ct Unit 8B
- 780 Maxine Ct Unit 8E
- 780 Maxine Ct Unit 8C
- 780 Maxine Ct Unit 8D
- 861 Maxine Ct Unit D
- 861 Maxine Ct Unit C
- 861 Maxine Ct Unit 4B
- 1854 Orchard Dr
- 1372 Cottage Dr Unit 16
- 1374 Cottage Dr Unit 15
- 1376 Cottage Dr Unit 14
- 1376 Cottage Dr Unit The Cottages on Farr
- 1341 Wycliffe Dr
- 1341 Wycliffe Dr Unit Market Common
- 1341 Wycliffe Dr Unit 18
- 1341 Wycliffe Dr Unit 18
- 1375 Cottage Dr Unit 8
- 1378 Cottage Dr Unit 13
- 1373 Cottage Dr Unit Cottages on Farrow P
- 1373 Cottage Dr Unit 7
- 1361 Wycliffe Dr Unit 23
- 1359 Wycliffe Dr Unit 22
- 1371 Cottage Dr Unit 6
- 1369 Cottage Dr Unit 5
- 1343 Wycliffe Dr Unit 19
- 1377 Cottage Dr Unit 9
- 1377 Cottage Dr Unit Farrow Parkway
- 1377 Cottage Dr Unit 9