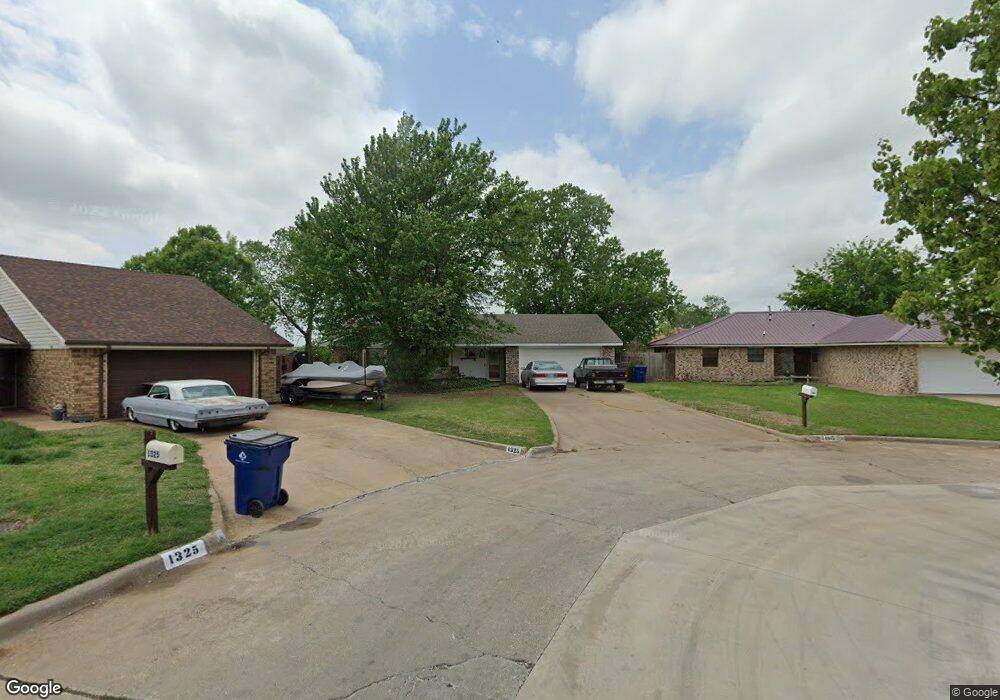
1372 Del Rey Cir Duncan, OK 73533
Estimated Value: $148,000 - $189,000
3
Beds
2
Baths
1,703
Sq Ft
$102/Sq Ft
Est. Value
About This Home
This home is located at 1372 Del Rey Cir, Duncan, OK 73533 and is currently estimated at $174,163, approximately $102 per square foot. 1372 Del Rey Cir is a home with nearby schools including Horace Mann Elementary School, Duncan Middle School, and Duncan High School.
Ownership History
Date
Name
Owned For
Owner Type
Purchase Details
Closed on
Nov 30, 2015
Sold by
Sissons Franklin J and Sissons Mary Katherine
Bought by
Tinney David L and Tinney Teresa M
Current Estimated Value
Home Financials for this Owner
Home Financials are based on the most recent Mortgage that was taken out on this home.
Original Mortgage
$115,844
Interest Rate
3.81%
Mortgage Type
New Conventional
Purchase Details
Closed on
Mar 23, 2012
Sold by
Parker John and Parker Jennifer
Bought by
Sissons Franklin J
Purchase Details
Closed on
Mar 31, 2008
Sold by
Hollinsworth Jackie E and Hollinsworth Shirlee
Bought by
Prker John and Parker Jennifer
Home Financials for this Owner
Home Financials are based on the most recent Mortgage that was taken out on this home.
Original Mortgage
$104,256
Interest Rate
6.19%
Mortgage Type
FHA
Purchase Details
Closed on
Nov 22, 2002
Sold by
Huckabaa Alan and Huckabaa Lisa M
Create a Home Valuation Report for This Property
The Home Valuation Report is an in-depth analysis detailing your home's value as well as a comparison with similar homes in the area
Purchase History
| Date | Buyer | Sale Price | Title Company |
|---|---|---|---|
| Tinney David L | $107,000 | None Available | |
| Sissons Franklin J | $105,000 | -- | |
| Prker John | $106,000 | Stewart Abstract & Title Of | |
| -- | $75,000 | -- |
Source: Public Records
Mortgage History
| Date | Status | Borrower | Loan Amount |
|---|---|---|---|
| Closed | Tinney David L | $115,844 | |
| Previous Owner | Prker John | $104,256 |
Source: Public Records
Tax History
| Year | Tax Paid | Tax Assessment Tax Assessment Total Assessment is a certain percentage of the fair market value that is determined by local assessors to be the total taxable value of land and additions on the property. | Land | Improvement |
|---|---|---|---|---|
| 2025 | $1,134 | $14,442 | $1,079 | $13,363 |
| 2024 | $1,080 | $13,614 | $1,079 | $12,535 |
| 2023 | $1,080 | $13,614 | $1,079 | $12,535 |
| 2022 | $1,006 | $13,217 | $1,079 | $12,138 |
| 2021 | $975 | $12,459 | $1,079 | $11,380 |
| 2020 | $981 | $12,362 | $1,079 | $11,283 |
| 2019 | $952 | $12,002 | $1,079 | $10,923 |
| 2018 | $996 | $12,178 | $1,079 | $11,099 |
| 2017 | $925 | $11,769 | $1,079 | $10,690 |
| 2016 | $942 | $12,084 | $1,079 | $11,005 |
| 2015 | $973 | $11,568 | $1,079 | $10,489 |
| 2014 | $973 | $11,568 | $1,079 | $10,489 |
Source: Public Records
Map
Nearby Homes
- 1377 Drexal Place
- 0 W Beech Ave
- 3425 Kacey St
- 261 N 29th St
- 208 N 29th St
- 903 N Harville Rd
- 2210 Western Dr
- 3450 W Elk Ave
- 2206 W Spruce Ave
- 209 N 22nd St
- 2086 N 44th St
- NO ADDRESS W Elk Ave
- 2002 Redbud Ave
- 2610 Virginia St
- 1309 Whisenant Ct
- 2110 W Main St
- 2006 W Oak Ave
- 1311 Whisenant Ct
- 1909 W Spruce Ave
- 2150 W Main St
- 726 Del Rey Cir
- 718 Del Rey Cir
- 721 Smith Rd
- 1385 Smith Rd
- 725 Smith Rd
- 714 Del Rey Cir
- 1367 Del Rey Cir
- 713 Smith Rd
- 1355 Del Rey Cir
- 725 Del Rey Cir
- 710 Del Rey Cir
- 3109 Clayton Ave
- 3111 Clayton Ave
- 1335 Smith Rd
- 713 Del Rey Cir
- 3323 Clayton Ave
- 3201 Clayton Ave
- 1330 Del Rey Cir
- 3101 Clayton Ave
- 1335 Del Rey Cir
Your Personal Tour Guide
Ask me questions while you tour the home.