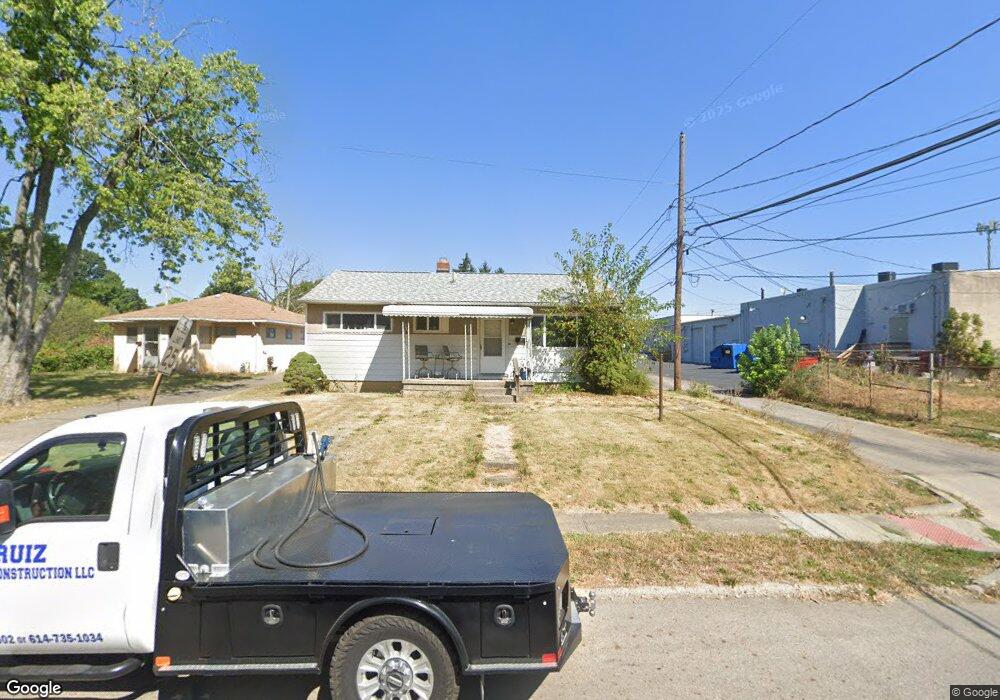
1372 Northridge Rd Columbus, OH 43224
North Linden NeighborhoodEstimated Value: $162,486 - $201,000
3
Beds
1
Bath
864
Sq Ft
$211/Sq Ft
Est. Value
About This Home
This home is located at 1372 Northridge Rd, Columbus, OH 43224 and is currently estimated at $182,622, approximately $211 per square foot. 1372 Northridge Rd is a home located in Franklin County with nearby schools including Maize Road Elementary School, Medina Middle School, and Mifflin High School.
Ownership History
Date
Name
Owned For
Owner Type
Purchase Details
Closed on
Aug 27, 2009
Sold by
Secretary Of Housing & Urban Development
Bought by
Y & R Investments & Development Inc
Current Estimated Value
Purchase Details
Closed on
Oct 28, 2008
Sold by
Wells Fargo Bank Na
Bought by
Secretary Of Housing & Urban Development
Purchase Details
Closed on
Oct 9, 2008
Sold by
Ford Colleen and Ford Colleen C
Bought by
Wells Fargo Bank Na
Purchase Details
Closed on
Sep 2, 2004
Sold by
Harper Mark
Bought by
Ford Colleen C
Home Financials for this Owner
Home Financials are based on the most recent Mortgage that was taken out on this home.
Original Mortgage
$79,373
Interest Rate
6.17%
Mortgage Type
Purchase Money Mortgage
Purchase Details
Closed on
Nov 1, 1996
Sold by
Faulkner Douglas C
Bought by
Harper Mark
Purchase Details
Closed on
Apr 19, 1988
Bought by
Faulkner Douglas C
Create a Home Valuation Report for This Property
The Home Valuation Report is an in-depth analysis detailing your home's value as well as a comparison with similar homes in the area
Home Values in the Area
Average Home Value in this Area
Purchase History
| Date | Buyer | Sale Price | Title Company |
|---|---|---|---|
| Y & R Investments & Development Inc | $25,501 | Tlc Title | |
| Secretary Of Housing & Urban Development | -- | None Available | |
| Wells Fargo Bank Na | $34,000 | None Available | |
| Ford Colleen C | $80,000 | Guardian Title | |
| Harper Mark | $45,000 | Guardian Title | |
| Harper Mark | $45,000 | -- | |
| Faulkner Douglas C | $43,000 | -- |
Source: Public Records
Mortgage History
| Date | Status | Borrower | Loan Amount |
|---|---|---|---|
| Previous Owner | Ford Colleen C | $79,373 | |
| Closed | Harper Mark | $0 |
Source: Public Records
Tax History Compared to Growth
Tax History
| Year | Tax Paid | Tax Assessment Tax Assessment Total Assessment is a certain percentage of the fair market value that is determined by local assessors to be the total taxable value of land and additions on the property. | Land | Improvement |
|---|---|---|---|---|
| 2024 | $3,367 | $53,550 | $17,150 | $36,400 |
| 2023 | $2,423 | $53,550 | $17,150 | $36,400 |
| 2022 | $2,906 | $29,930 | $8,190 | $21,740 |
| 2021 | $1,796 | $29,930 | $8,190 | $21,740 |
| 2020 | $1,729 | $29,930 | $8,190 | $21,740 |
| 2019 | $1,430 | $23,000 | $6,580 | $16,420 |
| 2018 | $1,380 | $23,000 | $6,580 | $16,420 |
| 2017 | $1,446 | $23,000 | $6,580 | $16,420 |
| 2016 | $1,485 | $21,530 | $5,670 | $15,860 |
| 2015 | $1,332 | $21,530 | $5,670 | $15,860 |
| 2014 | $1,335 | $21,530 | $5,670 | $15,860 |
| 2013 | $693 | $22,645 | $5,950 | $16,695 |
Source: Public Records
Map
Nearby Homes
- 1382 Elmore Ave
- 3585 Gerbert Rd
- 3519 Gerbert Rd
- 1507 Elmore Ave
- 1283 Pauline Ave
- 3491 Ontario St
- 1279 Carolyn Ave
- 3471 Ontario St
- 3749 Ganson Dr
- 3401 Walmar Dr
- 1270 Urana Ave
- 1258 Urana Ave
- 3352 Karl Rd
- 1496 E Cooke Rd
- 3583 Dresden St
- 1090 Pauline Ave
- 3469 Dresden St
- 3434 Norwood St
- 3591 Bremen St
- 3462 Dresden St
- 1366 Northridge Rd
- 1358 Northridge Rd
- 3651 Karl Rd
- 1352 Northridge Rd
- 3629 Karl Rd
- 1369 Northridge Rd
- 3643 Karl Rd
- 1361 Northridge Rd
- 1346 Northridge Rd
- 3671 Karl Rd
- 1355 Northridge Rd
- 3623 Karl Rd
- 1349 Northridge Rd
- 1340 Northridge Rd
- 3617 Karl Rd
- 1343 Northridge Rd
- 3677 Karl Rd Unit B
- 1336 Northridge Rd
- 3611 Karl Rd
- 1337 Northridge Rd