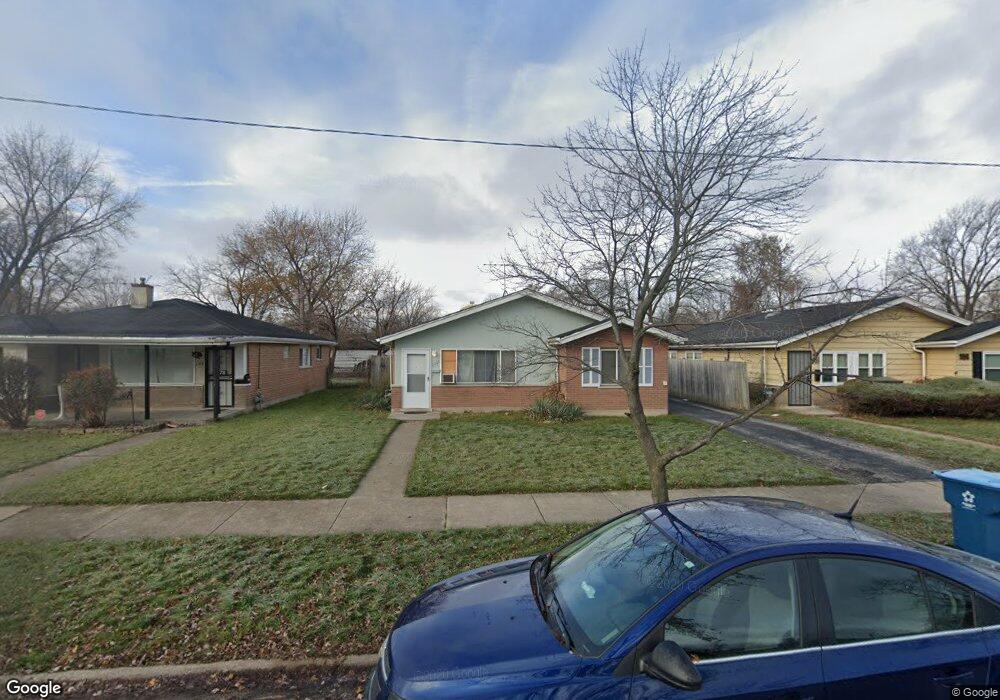
1372 Woodview Ave Calumet City, IL 60409
Estimated Value: $112,000 - $160,000
3
Beds
2
Baths
1,160
Sq Ft
$125/Sq Ft
Est. Value
About This Home
This home is located at 1372 Woodview Ave, Calumet City, IL 60409 and is currently estimated at $145,485, approximately $125 per square foot. 1372 Woodview Ave is a home located in Cook County with nearby schools including Hoover Elementary School, Schrum Memorial Middle School, and Thornton Fractional North High School.
Ownership History
Date
Name
Owned For
Owner Type
Purchase Details
Closed on
Apr 24, 2017
Sold by
Thomas Tomczak Roberta B and Scott Brian David
Bought by
Thomas Thomas Tomczak Roberta B Tomczak Roberta B and Roberta Thomas
Current Estimated Value
Purchase Details
Closed on
Jan 28, 2003
Sold by
Household Finance Corp Iii
Bought by
Tomczak Roberta B Thomas
Home Financials for this Owner
Home Financials are based on the most recent Mortgage that was taken out on this home.
Original Mortgage
$67,500
Interest Rate
6%
Purchase Details
Closed on
Oct 17, 2002
Sold by
Ellis Michael B and Ellis Mary K
Bought by
Household Finance Corp Iii
Purchase Details
Closed on
Mar 15, 1994
Sold by
Negri Paul M
Bought by
Ellis Michael B and Ellis Mary K
Home Financials for this Owner
Home Financials are based on the most recent Mortgage that was taken out on this home.
Original Mortgage
$69,834
Interest Rate
7.02%
Mortgage Type
FHA
Create a Home Valuation Report for This Property
The Home Valuation Report is an in-depth analysis detailing your home's value as well as a comparison with similar homes in the area
Home Values in the Area
Average Home Value in this Area
Purchase History
| Date | Buyer | Sale Price | Title Company |
|---|---|---|---|
| Thomas Thomas Tomczak Roberta B Tomczak Roberta B | -- | None Available | |
| Tomczak Roberta B Thomas | $75,000 | Cti | |
| Household Finance Corp Iii | -- | -- | |
| Ellis Michael B | $46,333 | -- |
Source: Public Records
Mortgage History
| Date | Status | Borrower | Loan Amount |
|---|---|---|---|
| Previous Owner | Tomczak Roberta B Thomas | $67,500 | |
| Previous Owner | Ellis Michael B | $69,834 |
Source: Public Records
Tax History Compared to Growth
Tax History
| Year | Tax Paid | Tax Assessment Tax Assessment Total Assessment is a certain percentage of the fair market value that is determined by local assessors to be the total taxable value of land and additions on the property. | Land | Improvement |
|---|---|---|---|---|
| 2024 | $8,133 | $12,368 | $2,508 | $9,860 |
| 2023 | $5,190 | $13,001 | $2,508 | $10,493 |
| 2022 | $5,190 | $6,088 | $2,213 | $3,875 |
| 2021 | $5,092 | $6,086 | $2,212 | $3,874 |
| 2020 | $4,301 | $6,086 | $2,212 | $3,874 |
| 2019 | $3,950 | $5,313 | $2,065 | $3,248 |
| 2018 | $4,834 | $6,461 | $2,065 | $4,396 |
| 2017 | $4,591 | $6,461 | $2,065 | $4,396 |
| 2016 | $3,754 | $5,571 | $1,917 | $3,654 |
| 2015 | $4,678 | $7,046 | $1,917 | $5,129 |
| 2014 | $4,499 | $7,046 | $1,917 | $5,129 |
| 2013 | $4,024 | $6,812 | $1,917 | $4,895 |
Source: Public Records
Map
Nearby Homes
- 1365 Imperial Ave
- 1290 Balmoral Ave
- 1287 Arthur St
- 1322 River Dr
- 1367 Buffalo Ave
- 1278 Balmoral Ave
- 1261 Balmoral Ave
- 1317 Mackinaw Ave
- 1229 Arthur St
- 1259 Cunningham Dr Unit 3W
- 1259 Cunningham Dr Unit 1E
- 1383 Greenbay Ave
- 1249 Cunningham Dr Unit 3E
- 916 William St
- 1253 Cunningham Dr Unit 2W
- 836 Williams St
- 1404 Burnham Ave
- 826 Williams St
- 1295 Greenbay Ave
- 1262 Greenbay Ave
- 1370 Woodview Ave Unit 3
- 1378 Woodview Ave
- 1366 Woodview Ave
- 1384 Woodview Ave
- 1371 Arthur St
- 1375 Arthur St
- 1367 Arthur St
- 1379 Arthur St
- 1362 Woodview Ave
- 1388 Woodview Ave
- 1363 Arthur St
- 1385 Arthur St
- 1373 Woodview Ave
- 1371 Woodview Ave
- 1379 Woodview Ave
- 1358 Woodview Ave
- 1367 Woodview Ave
- 1359 Arthur St
- 1385 Woodview Ave
- 1363 Woodview Ave