13720 Highway 59 Splendora, TX 77372
Estimated payment $10,317/month
4.9
Acres
$344,246
Price per Acre
213,444
Sq Ft Lot
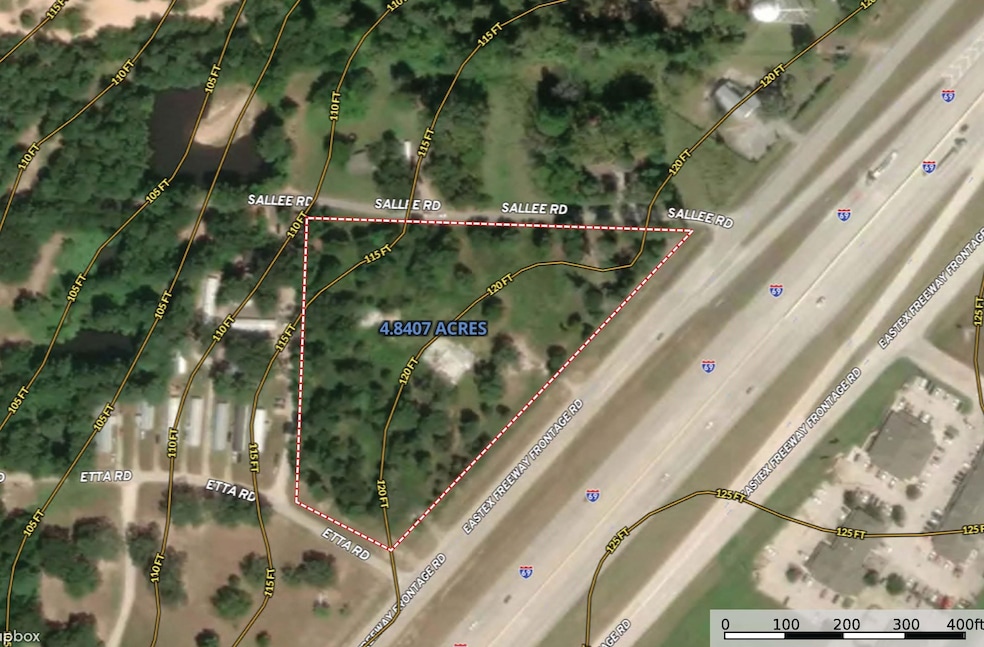
About This Lot
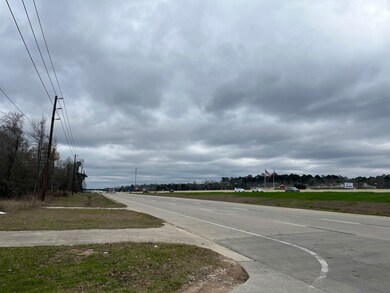
4.9 Acres only 39 miles north of Downtown Houston & 34 Miles south of Livingston. This property has Utilities avaliable with approximately 735ft of highway frontage. US-59 Exit 165 merges onto the frontage road in front of the property. There is (3) driveway access points onto the property which two of them is right after the off-ramp making it convenient access for a Gas Station/Food Court or commercial business. The on-ramp to US-59 is just 3/4 of a mile south of the property for easy access back onto the freeway.
Listing Provided By

Property Details
Property Type
- Land
Est. Annual Taxes
- $17,127
Lot Details
- Property fronts a highway
- Corner Lot
- Potential uses include commercial, for development
Map
Create a Home Valuation Report for This Property
The Home Valuation Report is an in-depth analysis detailing your home's value as well as a comparison with similar homes in the area
Home Values in the Area
Average Home Value in this Area
Tax History
| Year | Tax Paid | Tax Assessment Tax Assessment Total Assessment is a certain percentage of the fair market value that is determined by local assessors to be the total taxable value of land and additions on the property. | Land | Improvement |
|---|---|---|---|---|
| 2025 | $17,127 | $2,108,610 | $2,108,610 | -- |
| 2024 | $13,734 | $759,096 | -- | -- |
| 2023 | $13,734 | $632,580 | $632,580 | $0 |
| 2022 | $20,781 | $883,290 | $632,580 | $250,710 |
| 2021 | $6,425 | $265,430 | $105,430 | $160,000 |
| 2020 | $6,962 | $265,430 | $105,430 | $160,000 |
| 2019 | $6,806 | $247,970 | $96,810 | $151,160 |
| 2018 | $6,834 | $248,990 | $96,810 | $152,180 |
| 2017 | $6,480 | $248,990 | $96,810 | $152,180 |
| 2016 | $6,650 | $255,500 | $96,810 | $158,690 |
| 2015 | $7,259 | $311,600 | $145,220 | $166,380 |
| 2014 | $7,259 | $312,870 | $145,220 | $167,650 |
Source: Public Records
Property History
| Date | Event | Price | List to Sale | Price per Sq Ft |
|---|---|---|---|---|
| 12/23/2024 12/23/24 | For Sale | $2,108,610 | +25.0% | -- |
| 03/03/2023 03/03/23 | For Sale | $1,686,807 | -- | -- |
Purchase History
| Date | Type | Sale Price | Title Company |
|---|---|---|---|
| Special Warranty Deed | -- | None Available | |
| Deed | -- | -- | |
| Special Warranty Deed | -- | None Available | |
| Deed | -- | -- | |
| Special Warranty Deed | -- | None Available | |
| Deed | -- | -- | |
| Vendors Lien | -- | Houston Title Co |
Source: Public Records
Mortgage History
| Date | Status | Loan Amount | Loan Type |
|---|---|---|---|
| Previous Owner | $250,000 | Commercial |
Source: Public Records
Nearby Homes
- 00 U S 59
- 14054 Old Highway 59 N
- 14148 Old Highway 59 N
- 14144 Old Highway 59 N
- 14342 Old Hwy 59
- 25869 Magnolia Dr
- 26055 Fm 2090 Rd
- 25801 Coleman Dr
- 26341 Fm 2090 Rd
- 26597 E River Rd
- 0 Co Rd 2746 Unit 30136012
- 73 County Road 3703
- 26290 Fm 2090 Rd
- 0000 Farm To Market Road 2090
- 00 Farm To Market Road 2090
- 14390 Splenwood Dr
- 25966 E Christine Dr
- 14301 Splenwood Dr
- 14390 Half Cir
- 26410 Welch Ln
- 13548 White Ibis St
- 13544 White Ibis St
- 25373 Goodson Rd
- 26745 F M 2090 Rd E
- 26785 Fm 2090 Rd
- 26471 Joy Village Dr Unit B
- 26471 Joy Village Dr
- 27311 Kingport Dr
- 15609 All Star Dr
- 15613 All Star Dr
- 22828 Great Egret Dr
- 106 County Road 3704
- 23604 Nectar Crest Heights
- 14234 Northern Pintail Ct
- 14128 Upper Gardenia Ln
- 23792 Patchouli Terrace Dr
- 23792 Dr
- 11021 Patriot Ct
- 25777 John Wayne Dr
- 25432 Birch Ln