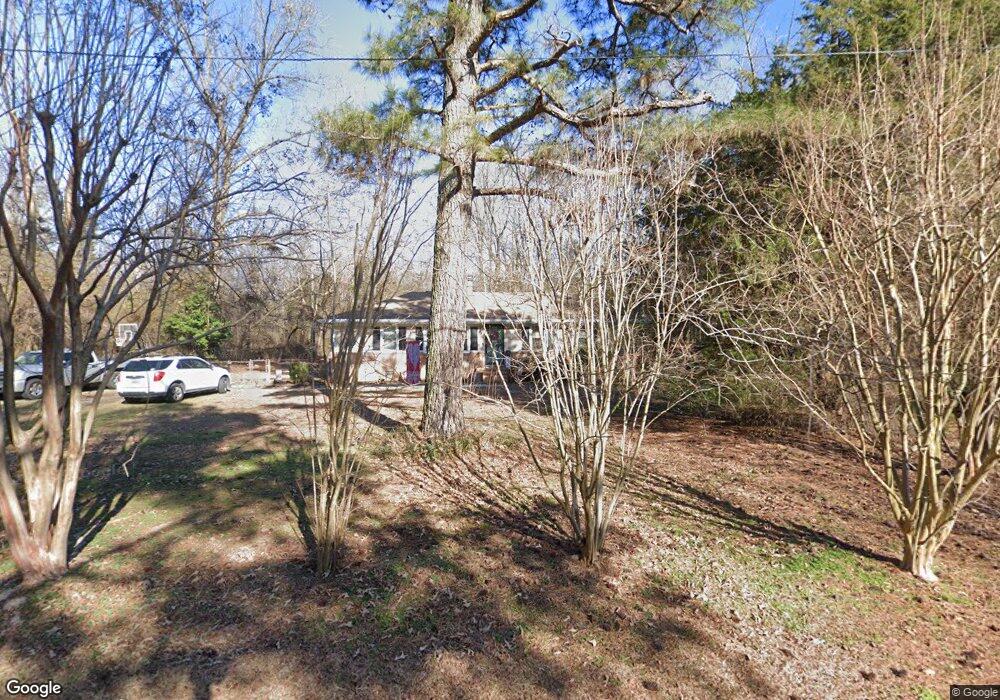
13721 Lawing Dr South Chesterfield, VA 23834
Bermuda Hundred NeighborhoodEstimated Value: $256,000 - $299,000
3
Beds
2
Baths
1,272
Sq Ft
$219/Sq Ft
Est. Value
About This Home
This home is located at 13721 Lawing Dr, South Chesterfield, VA 23834 and is currently estimated at $278,279, approximately $218 per square foot. 13721 Lawing Dr is a home located in Chesterfield County with nearby schools including Elizabeth Scott Elementary School, Elizabeth Davis Middle School, and Thomas Dale High School - Main Campus.
Ownership History
Date
Name
Owned For
Owner Type
Purchase Details
Closed on
Mar 30, 2016
Sold by
Dorrell Christina H
Bought by
Mckinley Korey W
Current Estimated Value
Home Financials for this Owner
Home Financials are based on the most recent Mortgage that was taken out on this home.
Original Mortgage
$136,482
Outstanding Balance
$109,098
Interest Rate
3.87%
Mortgage Type
FHA
Estimated Equity
$169,181
Purchase Details
Closed on
Jul 5, 2011
Sold by
Owens Robert R
Bought by
Hevener Christina M
Home Financials for this Owner
Home Financials are based on the most recent Mortgage that was taken out on this home.
Original Mortgage
$116,958
Interest Rate
4.75%
Mortgage Type
FHA
Purchase Details
Closed on
Jun 30, 2003
Sold by
Saunders Emilie
Bought by
Owens Robert
Home Financials for this Owner
Home Financials are based on the most recent Mortgage that was taken out on this home.
Original Mortgage
$81,225
Interest Rate
5.53%
Mortgage Type
FHA
Create a Home Valuation Report for This Property
The Home Valuation Report is an in-depth analysis detailing your home's value as well as a comparison with similar homes in the area
Home Values in the Area
Average Home Value in this Area
Purchase History
| Date | Buyer | Sale Price | Title Company |
|---|---|---|---|
| Mckinley Korey W | $141,500 | Appomattox Title Company Inc | |
| Hevener Christina M | $120,000 | -- | |
| Owens Robert | $82,500 | -- |
Source: Public Records
Mortgage History
| Date | Status | Borrower | Loan Amount |
|---|---|---|---|
| Open | Mckinley Korey W | $136,482 | |
| Previous Owner | Hevener Christina M | $116,958 | |
| Previous Owner | Owens Robert | $81,225 |
Source: Public Records
Tax History Compared to Growth
Tax History
| Year | Tax Paid | Tax Assessment Tax Assessment Total Assessment is a certain percentage of the fair market value that is determined by local assessors to be the total taxable value of land and additions on the property. | Land | Improvement |
|---|---|---|---|---|
| 2025 | $2,052 | $227,700 | $53,100 | $174,600 |
| 2024 | $2,052 | $191,300 | $50,400 | $140,900 |
| 2023 | $1,565 | $172,000 | $46,800 | $125,200 |
| 2022 | $1,493 | $162,300 | $37,800 | $124,500 |
| 2021 | $1,346 | $134,700 | $35,100 | $99,600 |
| 2020 | $1,247 | $131,300 | $35,100 | $96,200 |
| 2019 | $1,210 | $127,400 | $35,000 | $92,400 |
| 2018 | $1,210 | $127,400 | $35,000 | $92,400 |
| 2017 | $1,200 | $125,000 | $35,000 | $90,000 |
| 2016 | $1,134 | $118,100 | $35,000 | $83,100 |
| 2015 | $1,159 | $118,100 | $35,000 | $83,100 |
| 2014 | $1,125 | $114,600 | $35,000 | $79,600 |
Source: Public Records
Map
Nearby Homes
- 712 Dove Path Ln
- 1617 Clear Springs Ct
- 13308 Bermuda Place Dr
- 2420 Old Bermuda Hundred Rd
- 13824 Marsham Rd
- 1900 Walthall Creek Dr
- 13324 Naylors Blue Ct
- 1525 Creek Knoll Ct
- 14808 Green Forest Dr
- 13313 Silverdust Ln
- 13731 Nile Rd
- 13637 Laketree Dr
- 325 Kilt Dr
- 3005 Cicero Pkwy
- 14106 Kentwood Forest Dr
- 14604 Barkwood Ct
- 305 Redbird Dr
- 2713 Mistwood Forest Dr
- 2817 Calgary Ln
- 2821 Calgary Ln
- 13725 Lawing Dr
- 13711 Lawing Dr
- 13727 Lawing Dr
- 13729 Lawing Dr
- 13802 Lawing Dr
- 13732 Lawing Dr
- 13733 Lawing Dr
- 13825 Lawing Dr
- 13811 Lawing Dr
- 13707 Lawing Dr
- 13711 Lawing Dr
- 13706 Lawing Dr
- 13705 Lawing Dr
- 13704 Lawing Dr
- 13801 Lawing Dr
- 13702 Lawing Dr
- 13707 Lawing Dr
- 13804 Lawing Dr
- 13805 Lawing Dr
- 13700 Lawing Dr