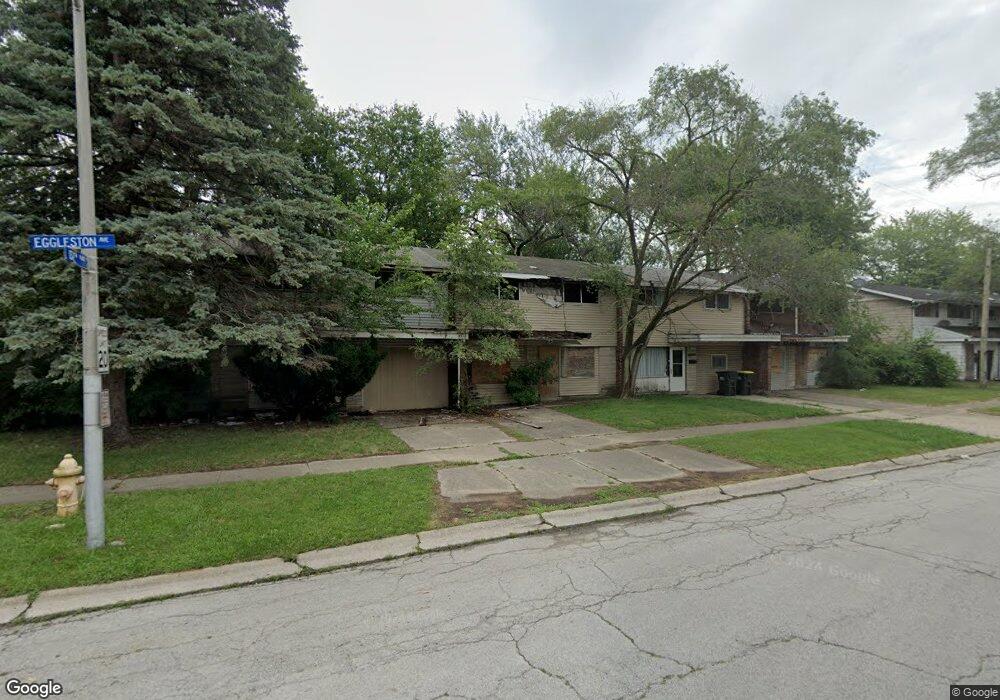
13727 S Eggleston Ave Riverdale, IL 60827
Estimated Value: $40,000 - $85,000
4
Beds
2
Baths
1,400
Sq Ft
$40/Sq Ft
Est. Value
About This Home
This home is located at 13727 S Eggleston Ave, Riverdale, IL 60827 and is currently estimated at $56,336, approximately $40 per square foot. 13727 S Eggleston Ave is a home located in Cook County with nearby schools including General George Patton Elementary School and Thornridge High School.
Ownership History
Date
Name
Owned For
Owner Type
Purchase Details
Closed on
Sep 3, 2009
Sold by
Nicks Betty J
Bought by
Machtemes Althea
Current Estimated Value
Purchase Details
Closed on
Jan 2, 2009
Sold by
Brandy Llc
Bought by
Nicks Betty J
Purchase Details
Closed on
Aug 31, 2005
Sold by
Nicks Betty J
Bought by
Brandy Llc
Purchase Details
Closed on
Dec 31, 2003
Sold by
First Community Bank & Trust
Bought by
Nicks Betty J
Home Financials for this Owner
Home Financials are based on the most recent Mortgage that was taken out on this home.
Original Mortgage
$46,400
Interest Rate
5.74%
Mortgage Type
Seller Take Back
Purchase Details
Closed on
Jul 29, 2002
Sold by
Jobe Bernice
Bought by
Machtemes Althea and Nicks Betty
Purchase Details
Closed on
Mar 12, 1997
Sold by
Roberts Edward J and Roberts Hermese E
Bought by
Edward J Roberts Living Trust
Create a Home Valuation Report for This Property
The Home Valuation Report is an in-depth analysis detailing your home's value as well as a comparison with similar homes in the area
Home Values in the Area
Average Home Value in this Area
Purchase History
| Date | Buyer | Sale Price | Title Company |
|---|---|---|---|
| Machtemes Althea | -- | None Available | |
| Nicks Betty J | -- | None Available | |
| Brandy Llc | -- | -- | |
| Nicks Betty J | -- | Millennium Title Gruop | |
| Machtemes Althea | $29,000 | -- | |
| Edward J Roberts Living Trust | -- | -- |
Source: Public Records
Mortgage History
| Date | Status | Borrower | Loan Amount |
|---|---|---|---|
| Previous Owner | Nicks Betty J | $46,400 |
Source: Public Records
Tax History Compared to Growth
Tax History
| Year | Tax Paid | Tax Assessment Tax Assessment Total Assessment is a certain percentage of the fair market value that is determined by local assessors to be the total taxable value of land and additions on the property. | Land | Improvement |
|---|---|---|---|---|
| 2024 | $2,606 | $3,500 | $912 | $2,588 |
| 2023 | $2,836 | $3,500 | $912 | $2,588 |
| 2022 | $2,836 | $3,094 | $791 | $2,303 |
| 2021 | $2,750 | $3,092 | $790 | $2,302 |
| 2020 | $2,583 | $3,092 | $790 | $2,302 |
| 2019 | $3,221 | $3,704 | $729 | $2,975 |
| 2018 | $3,168 | $3,704 | $729 | $2,975 |
| 2017 | $2,995 | $3,704 | $729 | $2,975 |
| 2016 | $2,942 | $3,598 | $669 | $2,929 |
| 2015 | $2,854 | $3,598 | $669 | $2,929 |
| 2014 | $2,819 | $3,598 | $669 | $2,929 |
| 2013 | $3,099 | $4,189 | $669 | $3,520 |
Source: Public Records
Map
Nearby Homes
- 13711 S Stewart Ave Unit A1E
- 13711 S Stewart Ave Unit 2W
- 13707 S Stewart Ave Unit 3E
- 13741 S Wallace Ave Unit 1
- 13710 S Wallace Ave
- 13827 S Tracy Ave
- 13842 S School St
- 13620 S Atlantic Ave
- 328 W 138th St
- 13827 S Wentworth Ave
- 13937 S School St
- 13923 S Wentworth Ave
- 13813 S Halsted St
- 13849 S Halsted St
- 14121 S Stewart Ave
- 13910 S Dearborn St
- 13916 S Dearborn St
- 13826 S State St
- 3 W 138th St
- 14130 S Atlantic Ave
- 13727 S Eggleston Ave Unit 1
- 13729 S Eggleston Ave
- 13729 S Eggleston Ave
- 13729 S Eggleston Ave Unit 1
- 13725 S Eggleston Ave
- 13731 S Eggleston Ave
- 13719 S Eggleston Ave
- 13737 S Eggleston Ave
- 13717 S Eggleston Ave
- 13739 S Eggleston Ave
- 13715 S Eggleston Ave
- 443 W 137th Place
- 13711 S Eggleston Ave
- 13741 S Eggleston Ave
- 445 W 137th Place
- 13709 S Eggleston Ave
- 13743 S Eggleston Ave
- 448 W 137th Place
- 13745 S Eggleston Ave
- 444 W Pacesetter Pkwy