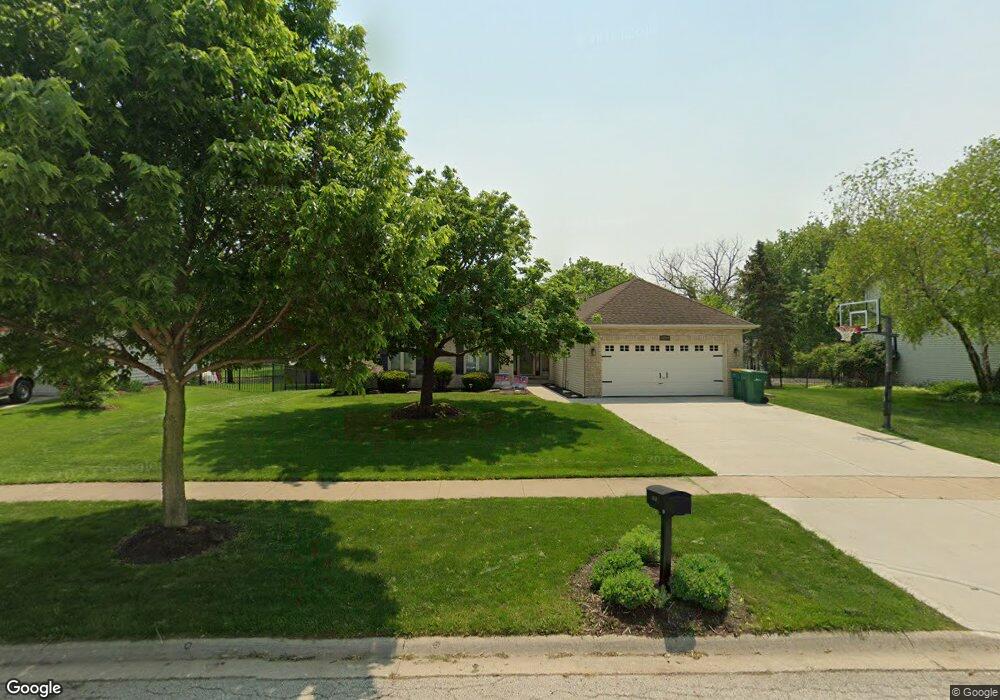
13727 S Quail Run Dr Plainfield, IL 60544
North Plainfield NeighborhoodEstimated Value: $402,612 - $556,000
--
Bed
--
Bath
1,646
Sq Ft
$285/Sq Ft
Est. Value
About This Home
This home is located at 13727 S Quail Run Dr, Plainfield, IL 60544 and is currently estimated at $468,903, approximately $284 per square foot. 13727 S Quail Run Dr is a home located in Will County with nearby schools including Eagle Pointe Elementary School, Richard Ira Jones Middle School, and Plainfield North High School.
Ownership History
Date
Name
Owned For
Owner Type
Purchase Details
Closed on
Aug 11, 2025
Sold by
Thomas Patricia A and Mardegan Revocable Living Trust
Bought by
Salvesen David and Salvesen Susan
Current Estimated Value
Home Financials for this Owner
Home Financials are based on the most recent Mortgage that was taken out on this home.
Original Mortgage
$125,000
Outstanding Balance
$124,887
Interest Rate
6.5%
Mortgage Type
New Conventional
Estimated Equity
$344,016
Purchase Details
Closed on
Dec 1, 2008
Sold by
Mardegan Gene L and Mardegan Patricia A
Bought by
Mardegan Gene L and Mardegan Patricia A
Purchase Details
Closed on
Nov 17, 1997
Sold by
Henkel Larry A and Henkel Lori A
Bought by
Mardegan Gene L and Mardegan Patricia A
Home Financials for this Owner
Home Financials are based on the most recent Mortgage that was taken out on this home.
Original Mortgage
$165,300
Interest Rate
8%
Purchase Details
Closed on
Apr 17, 1995
Sold by
Taylor Daniel C and Taylor Delma M
Bought by
Henkel Larry A and Henkel Lori A
Home Financials for this Owner
Home Financials are based on the most recent Mortgage that was taken out on this home.
Original Mortgage
$130,000
Interest Rate
8.12%
Create a Home Valuation Report for This Property
The Home Valuation Report is an in-depth analysis detailing your home's value as well as a comparison with similar homes in the area
Home Values in the Area
Average Home Value in this Area
Purchase History
| Date | Buyer | Sale Price | Title Company |
|---|---|---|---|
| Salvesen David | $450,000 | Chicago Title | |
| Mardegan Gene L | -- | None Available | |
| Mardegan Gene L | $174,000 | Prairie Title | |
| Henkel Larry A | $165,000 | Mid America Title Company |
Source: Public Records
Mortgage History
| Date | Status | Borrower | Loan Amount |
|---|---|---|---|
| Open | Salvesen David | $125,000 | |
| Previous Owner | Mardegan Gene L | $165,300 | |
| Previous Owner | Henkel Larry A | $130,000 |
Source: Public Records
Tax History Compared to Growth
Tax History
| Year | Tax Paid | Tax Assessment Tax Assessment Total Assessment is a certain percentage of the fair market value that is determined by local assessors to be the total taxable value of land and additions on the property. | Land | Improvement |
|---|---|---|---|---|
| 2024 | $8,446 | $122,568 | $33,094 | $89,474 |
| 2023 | $8,446 | $110,701 | $29,890 | $80,811 |
| 2022 | $8,074 | $99,424 | $26,845 | $72,579 |
| 2021 | $7,156 | $92,920 | $25,089 | $67,831 |
| 2020 | $7,051 | $90,284 | $24,377 | $65,907 |
| 2019 | $6,797 | $86,025 | $23,227 | $62,798 |
| 2018 | $6,486 | $80,825 | $21,823 | $59,002 |
| 2017 | $6,279 | $76,808 | $20,738 | $56,070 |
| 2016 | $6,118 | $73,255 | $19,779 | $53,476 |
| 2015 | $5,348 | $68,623 | $18,528 | $50,095 |
| 2014 | $5,348 | $61,807 | $17,874 | $43,933 |
| 2013 | $5,348 | $61,807 | $17,874 | $43,933 |
Source: Public Records
Map
Nearby Homes
- 24106 W Pheasant Chase Dr
- 13831 S Mallard Dr
- 14010 S Route 59 Unit 1
- 24434 Kennedy Cir
- 13531 Golden Eagle Cir
- 24127 Primrose Cir
- 13360 Vicky St
- 24860 Madison St
- 24331 Norwood Dr
- 24850 Michele Dr
- 24307 Sheffield Ln
- 24951 Thornberry Dr
- 24164 Norfolk Ln
- 14612 Paul Revere Ln
- 24622 George Washington Dr
- 24535 W Beckham Cir
- 24439 W Beckham Cir
- 13028 Bradford Ln Unit 1
- 13636 Savanna Dr
- 24117 Nottingham Ave Unit 3
- 13729 S Quail Run Dr
- 13725 S Quail Run Dr Unit 1
- 13731 S Quail Run Dr
- 13723 S Quail Run Dr
- 13726 S Quail Run Dr
- 13728 S Quail Run Dr
- 13722 S Quail Run Dr
- 13722 S Quail Run Dr
- 13730 S Quail Run Dr
- 13721 S Quail Run Dr
- 13719 S Quail Run Dr
- 13801 S Quail Run Dr
- 13732 S Quail Run Dr
- 13718 S Quail Run Dr
- 24211 W Pheasant Chase Dr
- 24215 W Pheasant Chase Dr
- 24207 W Pheasant Chase Dr
- 24128 W Joseph Ave
- 13802 S Quail Run Dr
- 13803 S Quail Run Dr