Estimated Value: $343,000 - $363,000
3
Beds
2
Baths
1,570
Sq Ft
$225/Sq Ft
Est. Value
About This Home
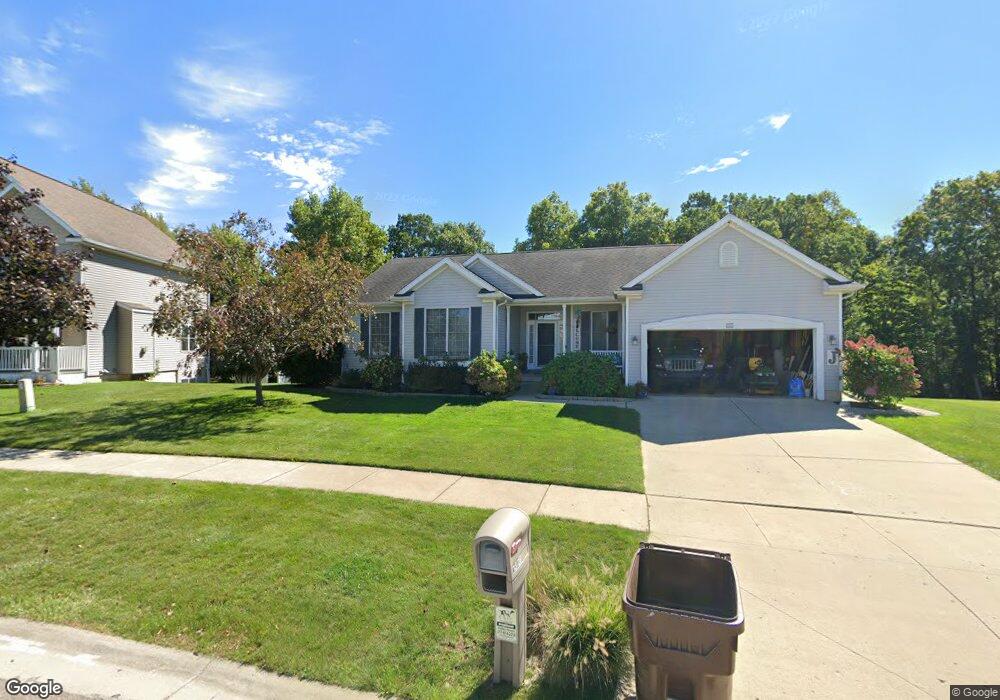
This home is located at 13728 Harvest Ln, Bath, MI 48808 and is currently estimated at $353,651, approximately $225 per square foot. 13728 Harvest Ln is a home located in Clinton County with nearby schools including Bath Elementary School, Bath Middle School, and Bath High School.
Ownership History
Date
Name
Owned For
Owner Type
Purchase Details
Closed on
Sep 9, 2019
Sold by
Jonas Christian D and Jonas Lorenda J
Bought by
Jonas Christian D and Jonas Lorenda L
Current Estimated Value
Home Financials for this Owner
Home Financials are based on the most recent Mortgage that was taken out on this home.
Original Mortgage
$193,325
Outstanding Balance
$129,094
Interest Rate
3.87%
Mortgage Type
FHA
Estimated Equity
$224,558
Purchase Details
Closed on
Oct 24, 2017
Sold by
Jonas Christian D and Jonas Lorenda L
Bought by
Jonas Christian D and Jonas Lorenda L
Purchase Details
Closed on
Jul 25, 2011
Sold by
Fannie Mae
Bought by
Jonas Lorenda and Jonas Christian
Home Financials for this Owner
Home Financials are based on the most recent Mortgage that was taken out on this home.
Original Mortgage
$158,650
Interest Rate
4.54%
Mortgage Type
New Conventional
Purchase Details
Closed on
Feb 11, 2011
Sold by
Cecil Benjamin and Cecil Melissa P
Bought by
Fannie Mae
Create a Home Valuation Report for This Property
The Home Valuation Report is an in-depth analysis detailing your home's value as well as a comparison with similar homes in the area
Home Values in the Area
Average Home Value in this Area
Purchase History
| Date | Buyer | Sale Price | Title Company |
|---|---|---|---|
| Jonas Christian D | -- | None Available | |
| Jonas Christian D | -- | Attorney | |
| Jonas Lorenda | $167,000 | Attorneys Title Agency Llc | |
| Fannie Mae | -- | None Available |
Source: Public Records
Mortgage History
| Date | Status | Borrower | Loan Amount |
|---|---|---|---|
| Open | Jonas Christian D | $193,325 | |
| Closed | Jonas Lorenda | $158,650 |
Source: Public Records
Tax History Compared to Growth
Tax History
| Year | Tax Paid | Tax Assessment Tax Assessment Total Assessment is a certain percentage of the fair market value that is determined by local assessors to be the total taxable value of land and additions on the property. | Land | Improvement |
|---|---|---|---|---|
| 2025 | $4,495 | $173,700 | $22,400 | $151,300 |
| 2024 | $1,409 | $164,900 | $18,200 | $146,700 |
| 2023 | $1,334 | $137,800 | $0 | $0 |
| 2022 | $4,060 | $125,200 | $17,300 | $107,900 |
| 2021 | $3,942 | $121,400 | $17,300 | $104,100 |
| 2020 | $3,839 | $120,100 | $16,800 | $103,300 |
| 2019 | $3,700 | $113,600 | $16,800 | $96,800 |
| 2018 | $3,564 | $105,600 | $16,800 | $88,800 |
| 2017 | $3,469 | $105,500 | $16,800 | $88,700 |
| 2016 | $3,459 | $101,400 | $15,700 | $85,700 |
| 2015 | -- | $100,600 | $0 | $0 |
| 2011 | -- | $92,500 | $0 | $0 |
Source: Public Records
Map
Nearby Homes
- 13747 Remington Dr
- 13717 Remington Dr
- 5603 Sleight Rd
- 13330 Nelson St
- 14192 Mulholland Dr
- 5884 Westover Dr
- 6020 Clark Rd
- 5236 Drumheller Rd
- 4340 Sleight Rd
- 4900 Hawk Hollow Dr E
- 15155 Mulligan Dr
- 15250 Mulligan Dr Unit 79
- 5162 Hawk Hollow Dr E Unit 6
- 6420 Clise Rd
- 5537 Timothy Ln
- 15380 Webster Rd
- 5522 Jessael Dr
- 15385 Temple Dr
- 4172 Hamlet Cove Unit 14
- 15507 Outer Dr
- 13718 Harvest Ln
- 13738 Harvest Ln
- 13748 Harvest Ln
- 13723 Harvest Ln
- 13698 Harvest Ln
- 13693 Harvest Ln
- 13768 Harvest Ln
- 13743 Harvest Ln
- 13763 Harvest Ln
- 13673 Harvest Ln
- 13778 Harvest Ln
- 13660 Hunters Crossing
- 13653 Harvest Ln
- 13777 Remington Dr
- 13798 Harvest Ln
- 13650 Hunters Crossing
- 13797 Remington Dr
- 13783 Harvest Ln
- 13633 Harvest Ln