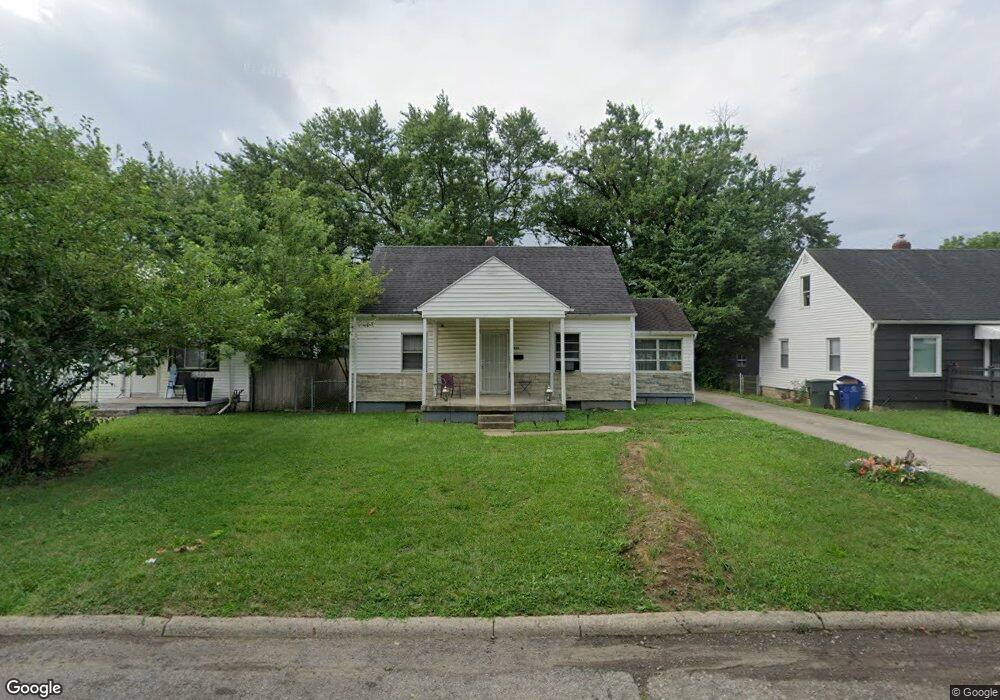
1373 Melrose Ave Columbus, OH 43224
North Linden NeighborhoodEstimated Value: $164,000 - $192,000
3
Beds
1
Bath
1,044
Sq Ft
$169/Sq Ft
Est. Value
About This Home
This home is located at 1373 Melrose Ave, Columbus, OH 43224 and is currently estimated at $175,988, approximately $168 per square foot. 1373 Melrose Ave is a home located in Franklin County with nearby schools including Como Elementary School, Dominion Middle School, and Whetstone High School.
Ownership History
Date
Name
Owned For
Owner Type
Purchase Details
Closed on
Jan 15, 2008
Sold by
Wells Fargo Bank Na
Bought by
Kjb Homes Llc
Current Estimated Value
Purchase Details
Closed on
Nov 20, 2007
Sold by
Coleman Chauncey and Case #06Cve12 17110
Bought by
Wells Fargo Bank Na and Ace Securities Corp Home Equity Loan Tru
Purchase Details
Closed on
Oct 28, 2002
Sold by
Epps Orlando R
Bought by
Coleman Chauncey and Coleman Monica
Home Financials for this Owner
Home Financials are based on the most recent Mortgage that was taken out on this home.
Original Mortgage
$52,500
Interest Rate
6.1%
Mortgage Type
Purchase Money Mortgage
Purchase Details
Closed on
Apr 27, 1978
Bought by
Epps Olando R
Create a Home Valuation Report for This Property
The Home Valuation Report is an in-depth analysis detailing your home's value as well as a comparison with similar homes in the area
Home Values in the Area
Average Home Value in this Area
Purchase History
| Date | Buyer | Sale Price | Title Company |
|---|---|---|---|
| Kjb Homes Llc | $34,000 | Accutitle Agency Inc | |
| Wells Fargo Bank Na | $42,000 | None Available | |
| Coleman Chauncey | $75,000 | -- | |
| Epps Olando R | $29,000 | -- |
Source: Public Records
Mortgage History
| Date | Status | Borrower | Loan Amount |
|---|---|---|---|
| Previous Owner | Coleman Chauncey | $52,500 |
Source: Public Records
Tax History
| Year | Tax Paid | Tax Assessment Tax Assessment Total Assessment is a certain percentage of the fair market value that is determined by local assessors to be the total taxable value of land and additions on the property. | Land | Improvement |
|---|---|---|---|---|
| 2025 | $2,499 | $54,540 | $13,690 | $40,850 |
| 2024 | $2,499 | $54,540 | $13,690 | $40,850 |
| 2023 | $2,468 | $54,530 | $13,685 | $40,845 |
| 2022 | $646 | $12,150 | $8,300 | $3,850 |
| 2021 | $980 | $12,150 | $8,300 | $3,850 |
| 2020 | $820 | $12,150 | $8,300 | $3,850 |
| 2019 | $631 | $10,150 | $6,930 | $3,220 |
| 2018 | $825 | $10,150 | $6,930 | $3,220 |
| 2017 | $1,160 | $27,370 | $6,930 | $20,440 |
| 2016 | $618 | $9,100 | $4,340 | $4,760 |
| 2015 | $563 | $9,100 | $4,340 | $4,760 |
| 2014 | $564 | $9,100 | $4,340 | $4,760 |
| 2013 | $278 | $9,100 | $4,340 | $4,760 |
Source: Public Records
Map
Nearby Homes
- 2873 Ontario St
- 1311 E Weber Rd
- 1398 Manchester Ave
- 2916 Hamilton Ave
- 1222 Manchester Ave
- 1416 Minnesota Ave
- 2981 Norwood St
- 1295 Minnesota Ave
- 1199 Minnesota Ave
- 1525 Aberdeen Ave
- 1591-1593 E Weber Rd
- 1166 Minnesota Ave
- 3056 Medina Ave
- 1411 Genessee Ave
- 2874 Grasmere Ave
- 3016 McGuffey Rd
- 2950 Grasmere Ave
- 1436 Arlington Ave
- 2574 Renwood Place
- 2888 Howey Rd
- 1365 Melrose Ave
- 1381 Melrose Ave
- 1361 Melrose Ave
- 1389 Melrose Ave
- 1355 Melrose Ave
- 1352 E Weber Rd
- 1374 E Weber Rd
- 1349 Melrose Ave
- 1397 Melrose Ave
- 1376 Melrose Ave
- 1382 Melrose Ave
- 1366 Melrose Ave
- 1348 E Weber Rd
- 1382 E Weber Rd
- 1386 Melrose Ave
- 1343 Melrose Ave
- 1358 Melrose Ave
- 1392 Melrose Ave
- 1344 E Weber Rd
- 1390 E Weber Rd
Your Personal Tour Guide
Ask me questions while you tour the home.