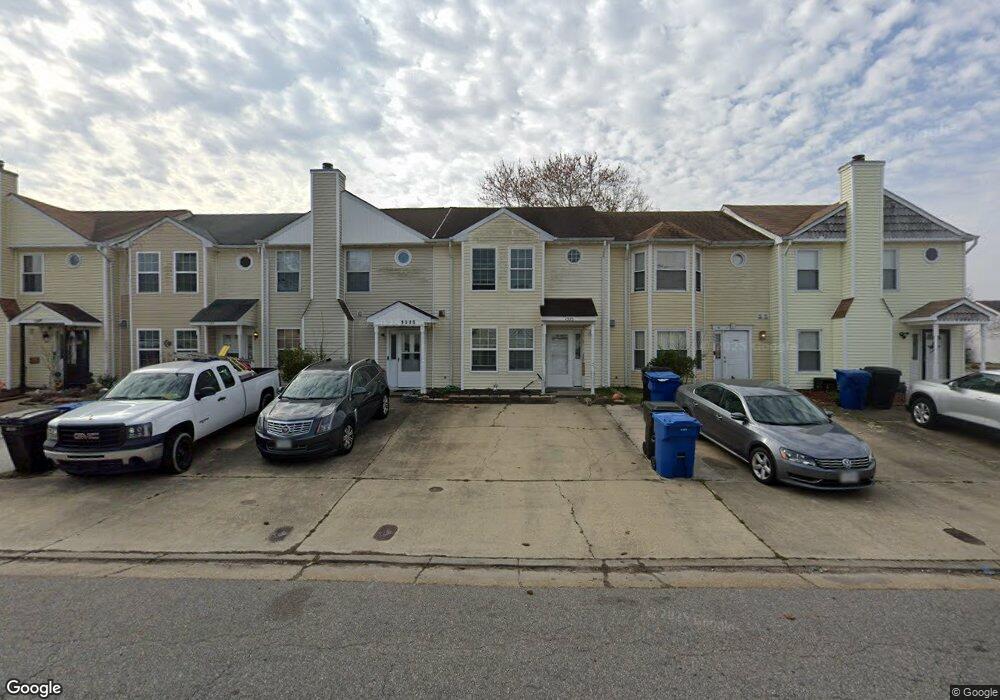
1373 Orillia Rd Virginia Beach, VA 23464
Estimated Value: $268,000 - $307,000
3
Beds
3
Baths
1,230
Sq Ft
$231/Sq Ft
Est. Value
About This Home
This home is located at 1373 Orillia Rd, Virginia Beach, VA 23464 and is currently estimated at $284,074, approximately $230 per square foot. 1373 Orillia Rd is a home located in Virginia Beach City with nearby schools including Glenwood Elementary School, Salem Middle School, and Salem High School.
Ownership History
Date
Name
Owned For
Owner Type
Purchase Details
Closed on
Oct 19, 2021
Sold by
Smith Tyrone K and Smith Dalesha T
Bought by
Fagan Bryer
Current Estimated Value
Home Financials for this Owner
Home Financials are based on the most recent Mortgage that was taken out on this home.
Original Mortgage
$213,400
Outstanding Balance
$194,601
Interest Rate
2.8%
Mortgage Type
New Conventional
Estimated Equity
$89,473
Purchase Details
Closed on
Oct 26, 2004
Sold by
Auzenne Joseph L
Bought by
Gaskin Dennis D
Home Financials for this Owner
Home Financials are based on the most recent Mortgage that was taken out on this home.
Original Mortgage
$96,000
Interest Rate
5.71%
Mortgage Type
New Conventional
Purchase Details
Closed on
Oct 20, 1999
Sold by
Everett Yolanda P
Bought by
Auzenne Joseph L
Home Financials for this Owner
Home Financials are based on the most recent Mortgage that was taken out on this home.
Original Mortgage
$58,500
Interest Rate
7.83%
Create a Home Valuation Report for This Property
The Home Valuation Report is an in-depth analysis detailing your home's value as well as a comparison with similar homes in the area
Home Values in the Area
Average Home Value in this Area
Purchase History
| Date | Buyer | Sale Price | Title Company |
|---|---|---|---|
| Fagan Bryer | $220,000 | Fidelity National Ttl Ins Co | |
| Gaskin Dennis D | $126,000 | -- | |
| Auzenne Joseph L | $65,000 | -- |
Source: Public Records
Mortgage History
| Date | Status | Borrower | Loan Amount |
|---|---|---|---|
| Open | Fagan Bryer | $213,400 | |
| Previous Owner | Gaskin Dennis D | $96,000 | |
| Previous Owner | Auzenne Joseph L | $58,500 |
Source: Public Records
Tax History Compared to Growth
Tax History
| Year | Tax Paid | Tax Assessment Tax Assessment Total Assessment is a certain percentage of the fair market value that is determined by local assessors to be the total taxable value of land and additions on the property. | Land | Improvement |
|---|---|---|---|---|
| 2025 | $2,256 | $247,600 | $75,000 | $172,600 |
| 2024 | $2,256 | $232,600 | $68,000 | $164,600 |
| 2023 | $1,951 | $197,100 | $56,000 | $141,100 |
| 2022 | $1,835 | $185,400 | $56,000 | $129,400 |
| 2021 | $1,521 | $153,600 | $46,000 | $107,600 |
| 2020 | $1,493 | $146,700 | $46,000 | $100,700 |
| 2019 | $1,398 | $133,000 | $43,000 | $90,000 |
| 2018 | $1,333 | $133,000 | $43,000 | $90,000 |
| 2017 | $1,261 | $125,800 | $41,000 | $84,800 |
| 2016 | $1,136 | $114,700 | $34,000 | $80,700 |
| 2015 | $1,089 | $110,000 | $39,200 | $70,800 |
| 2014 | $1,150 | $113,100 | $53,200 | $59,900 |
Source: Public Records
Map
Nearby Homes
- 1339 Orillia Rd
- 1324 Hafford Rd
- 1367 Hafford Rd
- 1550 Sangaree Cir
- 1617 Sweet Bay Ct
- 1445 Marmora Rd
- 1593 Mill Oak Dr
- 1421 Eddystone Dr Unit X9192
- 1287 Bridle Creek Blvd
- 1309 Smyrna Cir
- 1341 Sagamore Ct
- 5126 Settlers Park Dr
- 4905 Hillswick Dr
- 1613 Cliffwood Dr
- 5102 Settlers Park Dr
- 2020 Lyndora Rd
- 1936 Southaven Dr
- 5029 Hillswick Dr
- 4748 Ardmore Ln
- 1232 Northvale Dr
- 1375 Orillia Rd
- 1371 Orillia Rd
- 1377 Orillia Rd
- 1369 Orillia Rd
- 1367 Orillia Rd
- 1379 Orillia Rd
- 1365 Orillia Rd
- 1356 Longlac Rd
- 1358 Longlac Rd
- 1360 Longlac Rd
- 1354 Longlac Rd
- 1362 Longlac Rd
- 1352 Longlac Rd
- 1364 Longlac Rd
- 1350 Longlac Rd
- 1361 Orillia Rd
- 1348 Longlac Rd
- 1374 Orillia Rd
- 1372 Orillia Rd
- 1376 Orillia Rd