1373 Patten Mills Rd Cutler, OH 45724
Estimated Value: $149,438 - $241,000
2
Beds
1
Bath
1,748
Sq Ft
$104/Sq Ft
Est. Value
About This Home
This home is located at 1373 Patten Mills Rd, Cutler, OH 45724 and is currently estimated at $181,360, approximately $103 per square foot. 1373 Patten Mills Rd is a home with nearby schools including Warren High School.
Ownership History
Date
Name
Owned For
Owner Type
Purchase Details
Closed on
Dec 13, 2023
Sold by
Pinkerton-Holland Joan A and Pinkerton Larry E
Bought by
Pinkerton-Holland Joan A
Current Estimated Value
Purchase Details
Closed on
Sep 14, 2021
Sold by
Pinkerton Joan A and Pinkerton Larry E
Bought by
Pinkerton Holland Joan A
Purchase Details
Closed on
Apr 4, 2019
Sold by
Pinkerton Pinkerton Joan A Joan A and Pinkerton Larry E
Bought by
Pinkerton Joan A
Purchase Details
Closed on
Oct 13, 2016
Sold by
Pinkerton Joan A
Bought by
Pinkerton Joan A
Purchase Details
Closed on
Nov 20, 2015
Sold by
Pinkerton Joan A
Bought by
Pinkerton Joan A
Purchase Details
Closed on
Aug 21, 2013
Sold by
Pinkerton Joan A
Bought by
Pinkerton Joan A and The Bennett J Revocable Living Trust
Purchase Details
Closed on
May 11, 2000
Bought by
Pinkerton Larry E and Pinkerton Joan
Purchase Details
Closed on
Feb 16, 1993
Bought by
Wilson Joan A and Wilson Pinkerto
Create a Home Valuation Report for This Property
The Home Valuation Report is an in-depth analysis detailing your home's value as well as a comparison with similar homes in the area
Home Values in the Area
Average Home Value in this Area
Purchase History
| Date | Buyer | Sale Price | Title Company |
|---|---|---|---|
| Pinkerton-Holland Joan A | -- | None Listed On Document | |
| Pinkerton Holland Joan A | -- | None Available | |
| Pinkerton Joan A | -- | None Available | |
| Pinkerton Joan A | -- | Attorney | |
| Pinkerton Joan A | -- | Attorney | |
| Pinkerton Joan A | -- | Attorney | |
| Pinkerton Joan A | -- | Attorney | |
| Pinkerton Larry E | -- | -- | |
| Wilson Joan A | $28,000 | -- |
Source: Public Records
Tax History Compared to Growth
Tax History
| Year | Tax Paid | Tax Assessment Tax Assessment Total Assessment is a certain percentage of the fair market value that is determined by local assessors to be the total taxable value of land and additions on the property. | Land | Improvement |
|---|---|---|---|---|
| 2024 | $950 | $33,240 | $2,040 | $31,200 |
| 2023 | $950 | $33,240 | $2,040 | $31,200 |
| 2022 | $989 | $33,240 | $2,040 | $31,200 |
| 2021 | $1,092 | $34,400 | $3,630 | $30,770 |
| 2020 | $1,091 | $34,400 | $3,630 | $30,770 |
| 2019 | $1,077 | $34,400 | $3,630 | $30,770 |
| 2018 | $1,087 | $33,930 | $3,160 | $30,770 |
| 2017 | $1,082 | $33,930 | $3,160 | $30,770 |
| 2016 | $1,812 | $33,930 | $3,160 | $30,770 |
| 2015 | $691 | $27,100 | $3,190 | $23,910 |
| 2014 | $1,463 | $27,100 | $3,190 | $23,910 |
| 2013 | $346 | $27,100 | $3,190 | $23,910 |
Source: Public Records
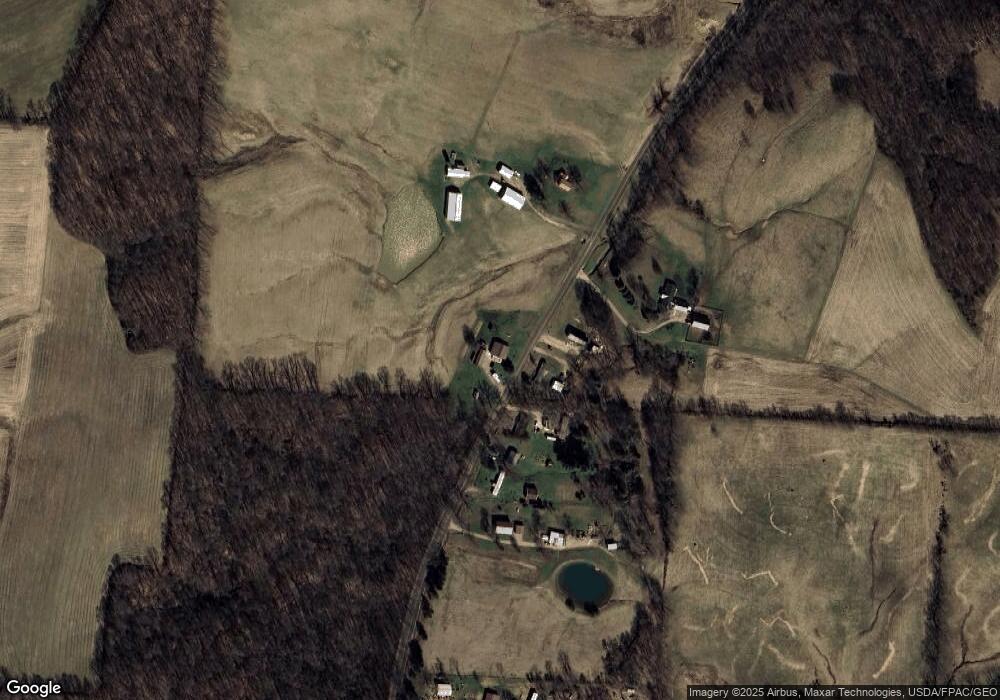
Map
Nearby Homes
- 2187 State Route 550
- 4000 C206
- Lot 2 Shinn Rd
- Lot 2 Shinn Rd
- Lot 1 Shinn Rd
- 1022 Tullis Rd
- 7600 Marion St
- 0 Ohio 555 Unit 5146049
- 22775 Mayle Ridge Rd
- 5174 Lightner Ridge Rd
- 4660 E J Ross Ln
- 0 Kosky Dr
- 3291 Kosky Dr
- 15901 Lathrop Rd
- 3111 Big Bottom Ln
- 2109 Bell Rd
- 0 Meadow St Unit Lot 9 5158299
- 0 Meadow St Unit Lot 9 225008020
- 1715 South St
- 1960 Broadway St
- 1400 Patten Mills Rd
- 1370 Patten Mills Rd
- 1340 Patten Mills Rd
- 1477 Patten Mills Rd
- 1302 Patten Mills Rd
- 1820 Patten Mills Rd
- 1775 Patten Mills Rd
- 550 Aldon Gage Rd
- 558 Williams Rd
- 2010 Patten Mills Rd
- 388 Aldon Gage Rd
- 431 Williams Rd
- 18081 State Route 555
- 18081 Ohio 555
- 2125 Sheets Rd
- 17612 State Route 555
- 300 Tall Pine Ln
- 18153 State Route 555
- 515 Patten Mills Rd
- 145 Boggs Rd