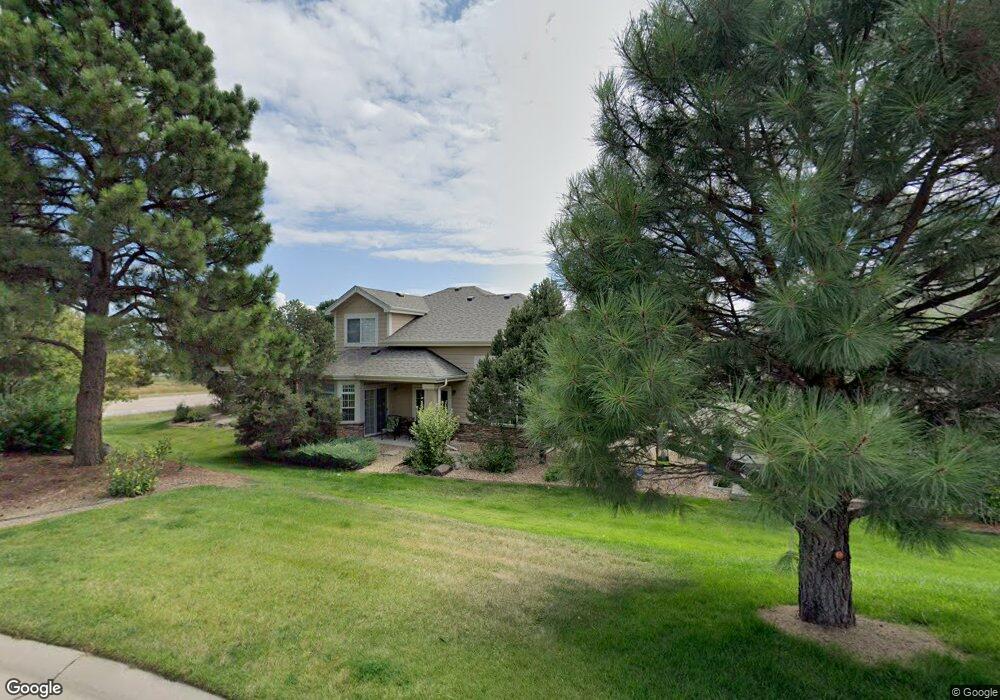
1373 Pineridge Ct Unit F2104 Castle Pines, CO 80108
Estimated Value: $510,000 - $555,105
2
Beds
3
Baths
1,700
Sq Ft
$315/Sq Ft
Est. Value
About This Home
This home is located at 1373 Pineridge Ct Unit F2104, Castle Pines, CO 80108 and is currently estimated at $535,776, approximately $315 per square foot. 1373 Pineridge Ct Unit F2104 is a home located in Douglas County with nearby schools including Timber Trail Elementary School, Rocky Heights Middle School, and Rock Canyon High School.
Ownership History
Date
Name
Owned For
Owner Type
Purchase Details
Closed on
Jun 30, 2016
Sold by
The Obrien Revocable Trust
Bought by
Dorsey Nancy L
Current Estimated Value
Purchase Details
Closed on
Oct 28, 2005
Sold by
Obrien Harold and Obrien Ann
Bought by
Obrien Harold A and Obrien Ann A
Purchase Details
Closed on
May 12, 2001
Sold by
Genesee Communities V Llc
Bought by
Joseph Manoj A
Home Financials for this Owner
Home Financials are based on the most recent Mortgage that was taken out on this home.
Original Mortgage
$168,898
Interest Rate
6.93%
Purchase Details
Closed on
Apr 12, 2001
Sold by
Genesee Communities V Llc
Bought by
Joseph Manoj A
Home Financials for this Owner
Home Financials are based on the most recent Mortgage that was taken out on this home.
Original Mortgage
$168,898
Interest Rate
6.93%
Create a Home Valuation Report for This Property
The Home Valuation Report is an in-depth analysis detailing your home's value as well as a comparison with similar homes in the area
Home Values in the Area
Average Home Value in this Area
Purchase History
| Date | Buyer | Sale Price | Title Company |
|---|---|---|---|
| Dorsey Nancy L | $315,000 | Guardian Title | |
| Obrien Harold A | -- | Security Title | |
| Obrien Harold | $227,500 | Security Title | |
| Joseph Manoj A | $211,100 | -- | |
| Joseph Manoj A | $211,123 | Land Title |
Source: Public Records
Mortgage History
| Date | Status | Borrower | Loan Amount |
|---|---|---|---|
| Previous Owner | Joseph Manoj A | $168,898 |
Source: Public Records
Tax History Compared to Growth
Tax History
| Year | Tax Paid | Tax Assessment Tax Assessment Total Assessment is a certain percentage of the fair market value that is determined by local assessors to be the total taxable value of land and additions on the property. | Land | Improvement |
|---|---|---|---|---|
| 2024 | $3,237 | $36,540 | -- | $36,540 |
| 2023 | $3,268 | $36,540 | $0 | $36,540 |
| 2022 | $2,626 | $27,370 | $0 | $27,370 |
| 2021 | $2,729 | $27,370 | $0 | $27,370 |
| 2020 | $2,634 | $26,200 | $1,790 | $24,410 |
| 2019 | $2,643 | $26,200 | $1,790 | $24,410 |
| 2018 | $2,264 | $22,130 | $1,440 | $20,690 |
| 2017 | $2,127 | $22,130 | $1,440 | $20,690 |
| 2016 | $2,259 | $20,640 | $1,590 | $19,050 |
| 2015 | $1,256 | $20,640 | $1,590 | $19,050 |
| 2014 | $1,042 | $16,330 | $1,590 | $14,740 |
Source: Public Records
Map
Nearby Homes
- 1033 Buffalo Ridge Rd
- 1055 Deer Clover Way
- 1006 Snow Lily Ct
- 13079 Whisper Canyon Rd
- 7164 Havenwood Dr
- 939 Greenway Ln
- 7350 Brixham Cir
- 811 Deer Clover Cir
- 750 Deer Clover Cir
- 8166 Wetherill Cir
- 894 Parkcliff Ln
- 7399 Norfolk Place
- 721 Stonemont Ct
- 7648 Bristolwood Dr
- 1095 Bramblewood Dr
- 1083 Golf Estates Point
- 8114 Briar Ridge Dr
- 527 Stonemont Dr
- 6577 Esperanza Dr
- 1094 Golf Estates Point
- 1375 Pineridge Ct Unit F2102
- 1377 Pineridge Ct Unit F2101
- 1379 Pineridge Ct Unit F2103
- 1387 Pineridge Ct Unit F1104
- 1385 Pineridge Ct Unit F1102
- 1389 Pineridge Ct Unit F1103
- 1391 Pineridge Ct Unit F1101
- 1364 Pineridge Ct Unit F3103
- 1358 Pineridge Ct Unit F3101
- 1404 Pineridge Ln Unit D1102
- 1360 Pineridge Ct Unit F3102
- 1360 Pineridge Ct Unit F-3F3-102
- 1406 Pineridge Ln Unit D1101
- 1362 Pineridge Ct Unit F3104
- 7528 Pineridge Trail Unit F5103
- 1374 Pineridge Ct Unit F4101
- 7526 Pineridge Trail
- 1418 Pineridge Ln Unit D2102
- 7524 Pineridge Trail Unit F5102
- 1368 Pineridge Ct Unit F4103