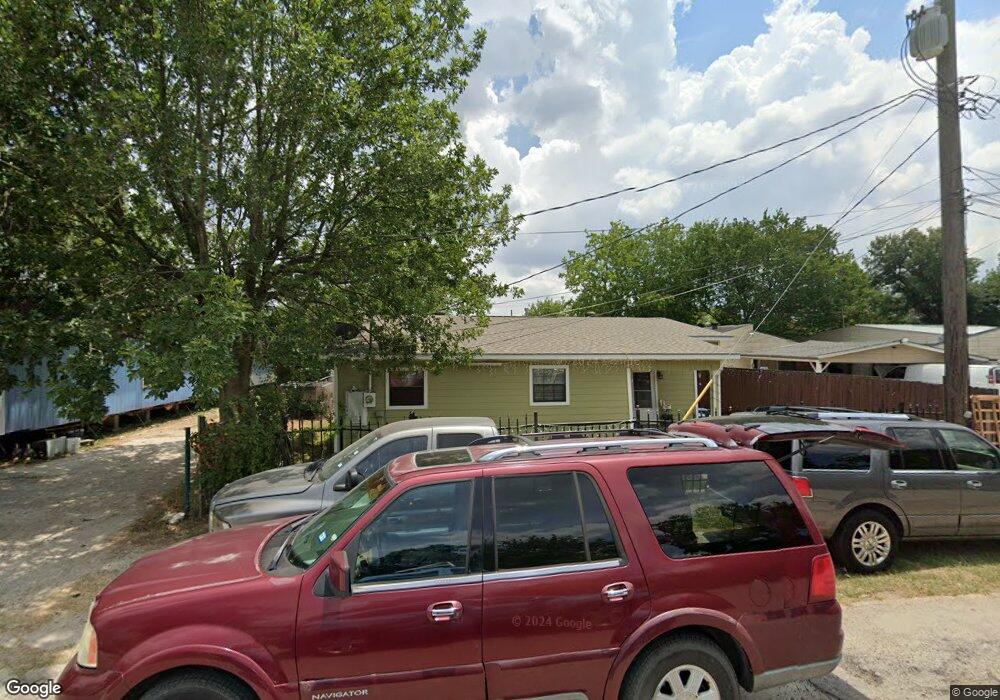
13730 Victoria St Houston, TX 77015
North Shore NeighborhoodEstimated Value: $170,000 - $204,000
2
Beds
1
Bath
1,498
Sq Ft
$123/Sq Ft
Est. Value
About This Home
This home is located at 13730 Victoria St, Houston, TX 77015 and is currently estimated at $184,276, approximately $123 per square foot. 13730 Victoria St is a home located in Harris County with nearby schools including North Shore Elementary School, Cobb 6th Grade Campus, and North Shore Middle School.
Ownership History
Date
Name
Owned For
Owner Type
Purchase Details
Closed on
Feb 21, 2018
Sold by
Cepeda Mario Alberto
Bought by
Cepeda Juanita and Esquivel Juanita Escalante
Current Estimated Value
Purchase Details
Closed on
May 27, 1998
Sold by
Cortez Rolando and Cortez Gladis
Bought by
Cepeda Mario Alberto and Cepeda Juanita
Home Financials for this Owner
Home Financials are based on the most recent Mortgage that was taken out on this home.
Original Mortgage
$36,500
Outstanding Balance
$7,410
Interest Rate
7.22%
Mortgage Type
Seller Take Back
Estimated Equity
$176,866
Purchase Details
Closed on
Apr 1, 1997
Sold by
Schroeder Rick and Schroeder Pam
Bought by
Cortez Rolando and Cortez Gladis
Home Financials for this Owner
Home Financials are based on the most recent Mortgage that was taken out on this home.
Original Mortgage
$36,500
Interest Rate
7.55%
Mortgage Type
Seller Take Back
Create a Home Valuation Report for This Property
The Home Valuation Report is an in-depth analysis detailing your home's value as well as a comparison with similar homes in the area
Home Values in the Area
Average Home Value in this Area
Purchase History
| Date | Buyer | Sale Price | Title Company |
|---|---|---|---|
| Cepeda Juanita | -- | None Available | |
| Cepeda Mario Alberto | -- | -- | |
| Cortez Rolando | -- | -- |
Source: Public Records
Mortgage History
| Date | Status | Borrower | Loan Amount |
|---|---|---|---|
| Open | Cepeda Mario Alberto | $36,500 | |
| Previous Owner | Cortez Rolando | $36,500 | |
| Closed | Cepeda Mario Alberto | $4,000 |
Source: Public Records
Tax History Compared to Growth
Tax History
| Year | Tax Paid | Tax Assessment Tax Assessment Total Assessment is a certain percentage of the fair market value that is determined by local assessors to be the total taxable value of land and additions on the property. | Land | Improvement |
|---|---|---|---|---|
| 2025 | $970 | $165,975 | $52,500 | $113,475 |
| 2024 | $970 | $162,718 | $52,500 | $110,218 |
| 2023 | $970 | $189,681 | $31,500 | $158,181 |
| 2022 | $2,125 | $151,233 | $31,500 | $119,733 |
| 2021 | $2,088 | $119,555 | $24,938 | $94,617 |
| 2020 | $1,945 | $99,125 | $24,938 | $74,187 |
| 2019 | $1,866 | $75,813 | $24,938 | $50,875 |
| 2018 | $370 | $60,819 | $24,938 | $35,881 |
| 2017 | $1,538 | $55,159 | $24,938 | $30,221 |
| 2016 | $1,538 | $55,159 | $24,938 | $30,221 |
| 2015 | $1,286 | $55,159 | $24,938 | $30,221 |
| 2014 | $1,286 | $47,273 | $18,375 | $28,898 |
Source: Public Records
Map
Nearby Homes
- 13505 Orleans St
- 13842 Laredo St
- 13430 Orleans St
- TBD Gainesville St
- 505 Evanston St
- 13529 Granada St
- 530 Frankie St Unit 1
- 13379 Louisville St
- 13362 Emporia St
- 1035 Nadolney St
- 13346 Louisville St
- 13326 Joliet St
- 13331 Emporia St
- 13350 Granada St
- 638 Hollywood St
- 14615 Victoria St
- 0 Victoria St
- 13218 Indianapolis St
- 13430 Duluth St
- 13434 Duluth St
- 13726 Victoria St
- 13722 Victoria St
- 13729 Corpus Christi St
- 13721 Corpus Christi St
- 13721 Victoria St
- 13731 Victoria St
- 13744 Victoria St
- 13717 Corpus Christi St
- 726 Nadolney St
- 710 Nadolney St
- 13717 Victoria St
- 0 Corpus Christi St
- 13730 Corpus Christi St
- 13730 Eagle Pass St
- 13726 Corpus Christi St
- 13722 Corpus Christi St
- 13742 Eagle Pass St
- 13738 Eagle Pass St
- 13718 Corpus Christi St
- 13744 Eagle Pass St