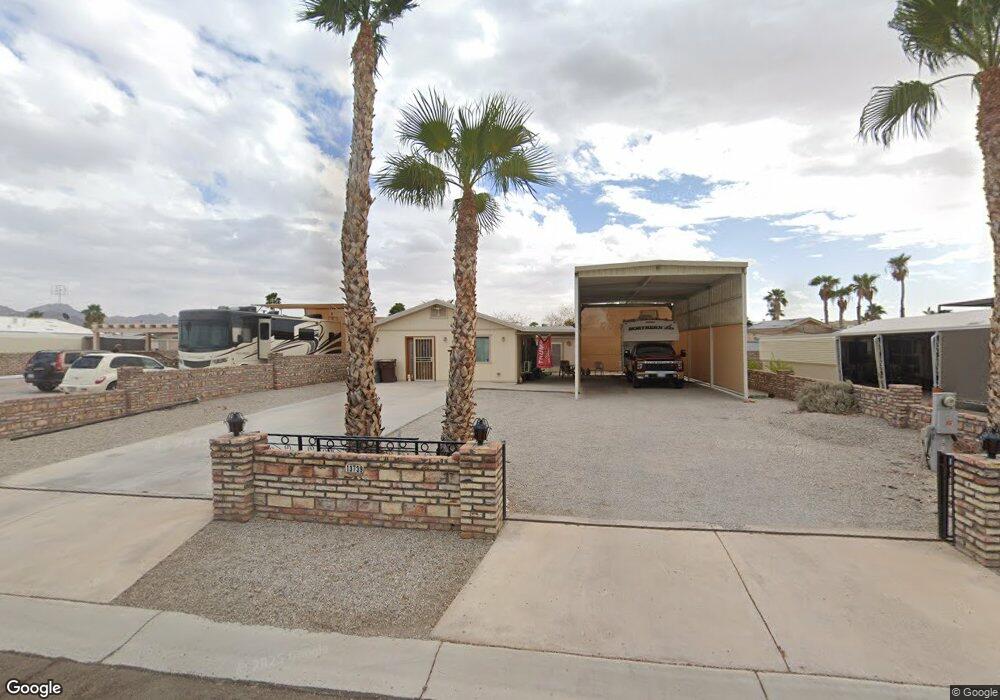
13739 E 52nd Dr Yuma, AZ 85367
Fortuna Foothills NeighborhoodEstimated Value: $211,443 - $240,000
1
Bed
2
Baths
720
Sq Ft
$315/Sq Ft
Est. Value
About This Home
This home is located at 13739 E 52nd Dr, Yuma, AZ 85367 and is currently estimated at $226,611, approximately $314 per square foot. 13739 E 52nd Dr is a home located in Yuma County with nearby schools including Mary A. Otondo Elementary School, Ron Watson Middle School, and Gila Ridge High School.
Ownership History
Date
Name
Owned For
Owner Type
Purchase Details
Closed on
Aug 28, 2023
Sold by
Kowalsky Gregory J
Bought by
Leroy R Ellis & Linda L Kowalsky Trust and Ellis
Current Estimated Value
Purchase Details
Closed on
Oct 27, 2022
Sold by
Dehart Norman L and Dehart Marilyn J
Bought by
Kowaslky Gregory J
Purchase Details
Closed on
Oct 15, 2020
Sold by
Black Robert Paul and Black Ruth Christine
Bought by
Dehart Norman L and Dehart Marilyn J
Purchase Details
Closed on
Dec 2, 2008
Sold by
Belcher Larry G and Belcher Jamie Ann
Bought by
Black Robert Paul and Black Ruth Christine
Purchase Details
Closed on
Jul 17, 2007
Sold by
Veis James and Veis Shirley A
Bought by
Belcher Larry G and Belcher Jamie Ann
Purchase Details
Closed on
Dec 7, 2004
Sold by
Matwychuck Edward and Matwychuck Jacqueline
Bought by
Veis James and Veis Shirley A
Purchase Details
Closed on
Mar 24, 1999
Sold by
Vukelich Stephen and Vukelich Penelope
Bought by
Matwycnuk Edward and Matwycnuk Jacqueline
Create a Home Valuation Report for This Property
The Home Valuation Report is an in-depth analysis detailing your home's value as well as a comparison with similar homes in the area
Home Values in the Area
Average Home Value in this Area
Purchase History
| Date | Buyer | Sale Price | Title Company |
|---|---|---|---|
| Leroy R Ellis & Linda L Kowalsky Trust | -- | -- | |
| Kowaslky Gregory J | $205,000 | Chicago Title | |
| Dehart Norman L | $164,500 | Chicago Title Agency Inc | |
| Black Robert Paul | $98,500 | Chicago Title | |
| Belcher Larry G | $70,000 | Yuma Title | |
| Veis James | $50,000 | Yuma Title | |
| Matwycnuk Edward | -- | -- |
Source: Public Records
Tax History
| Year | Tax Paid | Tax Assessment Tax Assessment Total Assessment is a certain percentage of the fair market value that is determined by local assessors to be the total taxable value of land and additions on the property. | Land | Improvement |
|---|---|---|---|---|
| 2025 | $1,201 | $12,618 | $5,201 | $7,417 |
| 2024 | $1,188 | $12,017 | $4,954 | $7,063 |
| 2023 | $1,188 | $11,445 | $4,746 | $6,699 |
| 2022 | $1,147 | $10,900 | $4,523 | $6,377 |
| 2021 | $1,210 | $10,381 | $3,990 | $6,391 |
| 2020 | $1,105 | $9,887 | $3,723 | $6,164 |
| 2019 | $1,091 | $9,416 | $3,755 | $5,661 |
| 2018 | $1,048 | $8,967 | $3,510 | $5,457 |
| 2017 | $1,005 | $8,967 | $3,510 | $5,457 |
| 2016 | $1,031 | $8,134 | $3,573 | $4,561 |
| 2015 | $832 | $7,747 | $3,623 | $4,124 |
| 2014 | $832 | $7,378 | $5,000 | $2,378 |
Source: Public Records
Map
Nearby Homes
- 13693 E 53 St
- 13780 E 53rd Ln
- 13641 E 52nd Dr
- 13656 E 52nd St
- 13824 E 52nd St
- 13657 E 51st Ln
- 13615 E 53rd Dr
- 13854 E 52nd St
- 13592 E 52nd St
- 13902 E 53rd Dr
- 13635 E 52nd St
- 13574 E 53rd Ln
- 13547 E 53rd St
- 13799 E 51st St
- 13571 E 51st Ln
- 13603 E 51st Place
- 13211 E 54th St
- 13531 E 53rd St
- 14141 E 52nd St
- 13241 E 55th St
- 13739 E 52nd St
- 13729 E 52nd Dr
- 13742 E 53rd St
- 13728 E 53rd St
- 13752 E 53rd St
- 13711 E 52nd Dr
- 13728 E 52nd Dr
- 13762 E 53rd St
- 13748 E 52nd Dr
- 13758 E 52 Dr
- 13758 E 52nd Dr
- 13772 E 53rd St
- 13739 E 53rd St
- 13768 E 52nd Dr
- 13768 E 52nd Dr
- 13706 E 52nd Dr
- 13782 E 53rd St
- 13747 E 52nd St
- 13737 E 52nd St
- 13753 E 53rd St
Your Personal Tour Guide
Ask me questions while you tour the home.