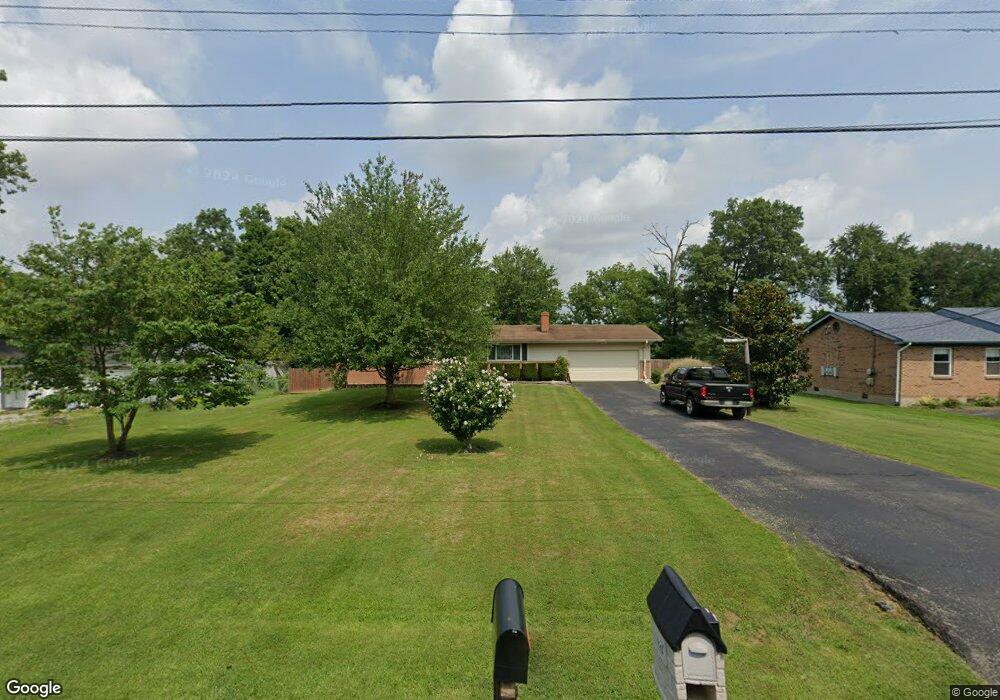
1374 Fay Rd Loveland, OH 45140
Estimated Value: $287,000 - $331,797
5
Beds
2
Baths
1,242
Sq Ft
$255/Sq Ft
Est. Value
About This Home
This home is located at 1374 Fay Rd, Loveland, OH 45140 and is currently estimated at $317,199, approximately $255 per square foot. 1374 Fay Rd is a home located in Clermont County with nearby schools including Marr/Cook Elementary School, Spaulding Elementary School, and Goshen Middle School.
Ownership History
Date
Name
Owned For
Owner Type
Purchase Details
Closed on
Mar 23, 2006
Sold by
Daniel Roseanna
Bought by
Daniel Michael W
Current Estimated Value
Purchase Details
Closed on
Nov 12, 2004
Sold by
Daniel Michael W and Daniel Roseanna
Bought by
Daniel Michael W and Daniel Roseanna
Home Financials for this Owner
Home Financials are based on the most recent Mortgage that was taken out on this home.
Original Mortgage
$150,000
Interest Rate
5.86%
Mortgage Type
New Conventional
Purchase Details
Closed on
Aug 1, 1997
Sold by
Daniel M Wash
Bought by
Michael W Daniel and Daniel
Home Financials for this Owner
Home Financials are based on the most recent Mortgage that was taken out on this home.
Original Mortgage
$72,000
Interest Rate
7.75%
Mortgage Type
New Conventional
Purchase Details
Closed on
Jul 1, 1987
Create a Home Valuation Report for This Property
The Home Valuation Report is an in-depth analysis detailing your home's value as well as a comparison with similar homes in the area
Home Values in the Area
Average Home Value in this Area
Purchase History
| Date | Buyer | Sale Price | Title Company |
|---|---|---|---|
| Daniel Michael W | -- | None Available | |
| Daniel Michael W | -- | Tri State Title | |
| Michael W Daniel | $122,500 | -- | |
| -- | $67,000 | -- |
Source: Public Records
Mortgage History
| Date | Status | Borrower | Loan Amount |
|---|---|---|---|
| Previous Owner | Daniel Michael W | $150,000 | |
| Previous Owner | Michael W Daniel | $72,000 |
Source: Public Records
Tax History Compared to Growth
Tax History
| Year | Tax Paid | Tax Assessment Tax Assessment Total Assessment is a certain percentage of the fair market value that is determined by local assessors to be the total taxable value of land and additions on the property. | Land | Improvement |
|---|---|---|---|---|
| 2024 | $4,100 | $91,880 | $19,180 | $72,700 |
| 2023 | $3,974 | $91,880 | $19,180 | $72,700 |
| 2022 | $3,078 | $62,620 | $12,850 | $49,770 |
| 2021 | $3,097 | $62,620 | $12,850 | $49,770 |
| 2020 | $2,893 | $62,620 | $12,850 | $49,770 |
| 2019 | $2,447 | $50,820 | $11,760 | $39,060 |
| 2018 | $2,457 | $50,820 | $11,760 | $39,060 |
| 2017 | $2,262 | $50,820 | $11,760 | $39,060 |
| 2016 | $2,262 | $43,820 | $10,150 | $33,670 |
| 2015 | $2,041 | $43,820 | $10,150 | $33,670 |
| 2014 | $2,041 | $43,820 | $10,150 | $33,670 |
| 2013 | $1,891 | $42,420 | $10,150 | $32,270 |
Source: Public Records
Map
Nearby Homes
- 6467 Smith Rd
- 6395 Barre Rd
- 1376 Barre Ln
- 6108 Donna Jay Dr
- 1480 Fay Rd Unit 202
- 1480 Fay Rd Unit 70
- 1480 Fay Rd Unit 28
- 1480 Fay Rd Unit 216
- 1480 Fay Rd Unit Lot 104
- 1480 Fay Rd Unit 34
- 1480 Fay Rd Unit 50
- 1480 Fay Rd Unit 105
- 1480 Fay Rd Unit 191
- 1480 Fay Rd Unit 143
- 1480 Fay Rd Unit 24
- 1480 Fay Rd Unit Lot 135
- 1480 Fay Rd Unit 45
- 1480 Fay Rd Unit 6
- 1480 Fay Rd Unit 80
- 3269 Thoroughbred Dr