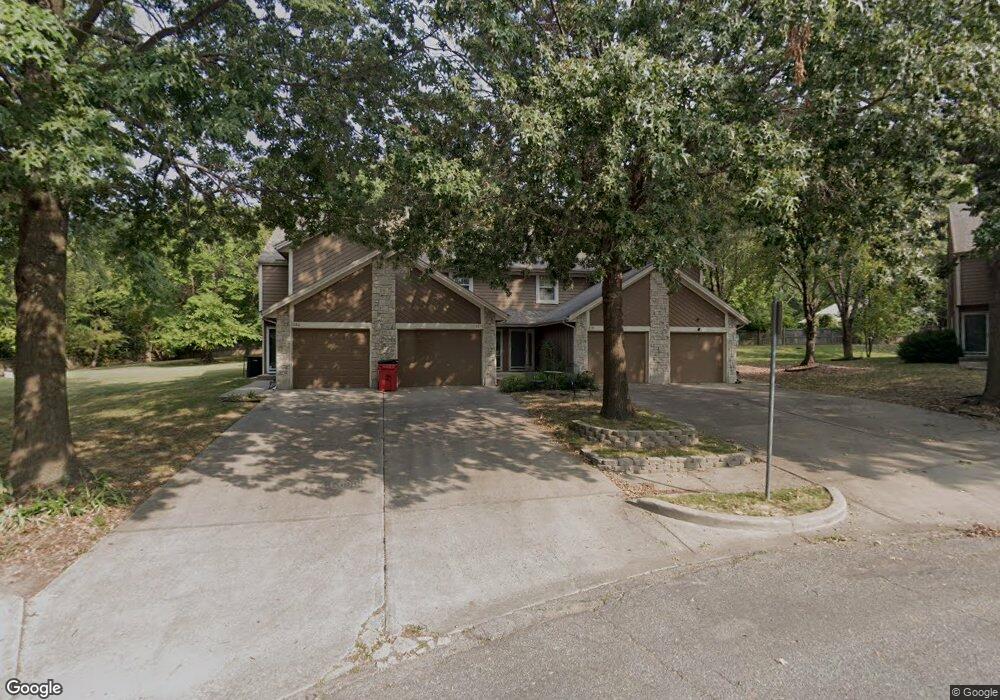
1374 NW Jefferson Ct Blue Springs, MO 64015
Estimated Value: $183,626 - $199,000
2
Beds
2
Baths
1,248
Sq Ft
$153/Sq Ft
Est. Value
About This Home
This home is located at 1374 NW Jefferson Ct, Blue Springs, MO 64015 and is currently estimated at $190,407, approximately $152 per square foot. 1374 NW Jefferson Ct is a home located in Jackson County with nearby schools including James Lewis Elementary School, Brittany Hill Middle School, and Blue Springs High School.
Ownership History
Date
Name
Owned For
Owner Type
Purchase Details
Closed on
Jan 5, 2022
Sold by
Schnell Kevin C
Bought by
Old Teneriffe Llc
Current Estimated Value
Purchase Details
Closed on
Jun 28, 2021
Sold by
Smith Ashley and Bel Anthony
Bought by
Fry Chao and Smith Fry Michelle
Purchase Details
Closed on
Feb 21, 2004
Sold by
Griffin Carolyn A Atwood and Griffin Arvil
Bought by
Dickey Ronald
Home Financials for this Owner
Home Financials are based on the most recent Mortgage that was taken out on this home.
Original Mortgage
$101,455
Interest Rate
6.75%
Mortgage Type
Purchase Money Mortgage
Purchase Details
Closed on
Nov 6, 1996
Sold by
Rinehart Bill G and Rinehart Judy
Bought by
Atwood Carolyn A
Home Financials for this Owner
Home Financials are based on the most recent Mortgage that was taken out on this home.
Original Mortgage
$40,000
Interest Rate
7.62%
Mortgage Type
Purchase Money Mortgage
Create a Home Valuation Report for This Property
The Home Valuation Report is an in-depth analysis detailing your home's value as well as a comparison with similar homes in the area
Home Values in the Area
Average Home Value in this Area
Purchase History
| Date | Buyer | Sale Price | Title Company |
|---|---|---|---|
| Old Teneriffe Llc | -- | Alliance Title | |
| Fry Chao | -- | None Available | |
| Dickey Ronald | -- | Stewart Title | |
| Atwood Carolyn A | -- | -- |
Source: Public Records
Mortgage History
| Date | Status | Borrower | Loan Amount |
|---|---|---|---|
| Previous Owner | Dickey Ronald | $101,455 | |
| Previous Owner | Atwood Carolyn A | $40,000 |
Source: Public Records
Tax History Compared to Growth
Tax History
| Year | Tax Paid | Tax Assessment Tax Assessment Total Assessment is a certain percentage of the fair market value that is determined by local assessors to be the total taxable value of land and additions on the property. | Land | Improvement |
|---|---|---|---|---|
| 2025 | $1,960 | $25,028 | $5,464 | $19,564 |
| 2024 | $1,922 | $24,026 | $1,910 | $22,116 |
| 2023 | $1,922 | $24,026 | $2,915 | $21,111 |
| 2022 | $1,892 | $20,900 | $1,216 | $19,684 |
| 2021 | $1,890 | $20,900 | $1,216 | $19,684 |
| 2020 | $1,629 | $18,317 | $1,216 | $17,101 |
| 2019 | $1,575 | $18,317 | $1,216 | $17,101 |
| 2018 | $1,580 | $17,695 | $1,725 | $15,970 |
| 2017 | $1,537 | $17,695 | $1,725 | $15,970 |
| 2016 | $1,537 | $17,252 | $1,520 | $15,732 |
| 2014 | $1,365 | $15,270 | $1,656 | $13,614 |
Source: Public Records
Map
Nearby Homes
- 1389 NW Jefferson Ct
- 1400 NW Deer Run Trail
- 1501 NW 18th St
- 1604 NW Sunridge Dr
- 1701 NW Duncan Rd
- 1513 NW Weatherstone Ct
- 1601 NW Weatherstone Ct
- 1109 NW Mock Ave
- 1618 NW Samantha Ct
- 2317 NW Kensington Ct
- 913 NW Camelot Ct
- 2804 NW Kingsridge Dr
- 2508 NW Castle Dr
- 1029 NW Berkshire Dr
- 1113 NW Forest Dr
- 2117 NW Parker Ct
- 2100 NW Parker Ct
- 804 NW Maynard St
- 1000 NW Forest Dr
- 503 NW 15th St
- 1378 NW Jefferson Ct
- 1382 NW Jefferson Ct
- 1362 NW Jefferson Ct
- 1358 NW Jefferson Ct
- 1400 NW Jefferson Ct
- 1354 NW Jefferson Ct
- 1404 NW Jefferson Ct
- 1350 NW Jefferson Ct
- 1408 NW Jefferson Ct
- 1412 NW Jefferson Ct
- 1342 NW Jefferson Ct
- 1401 NW Jefferson Ct
- 1397 NW Jefferson Ct
- 1338 NW Jefferson Ct
- 1393 NW Jefferson Ct
- 1334 NW Jefferson Ct
- 1307 NW Deer Run Trail
- 1330 NW Jefferson Ct
- 1347 NW Jefferson Ct
- 1359 NW Jefferson Ct