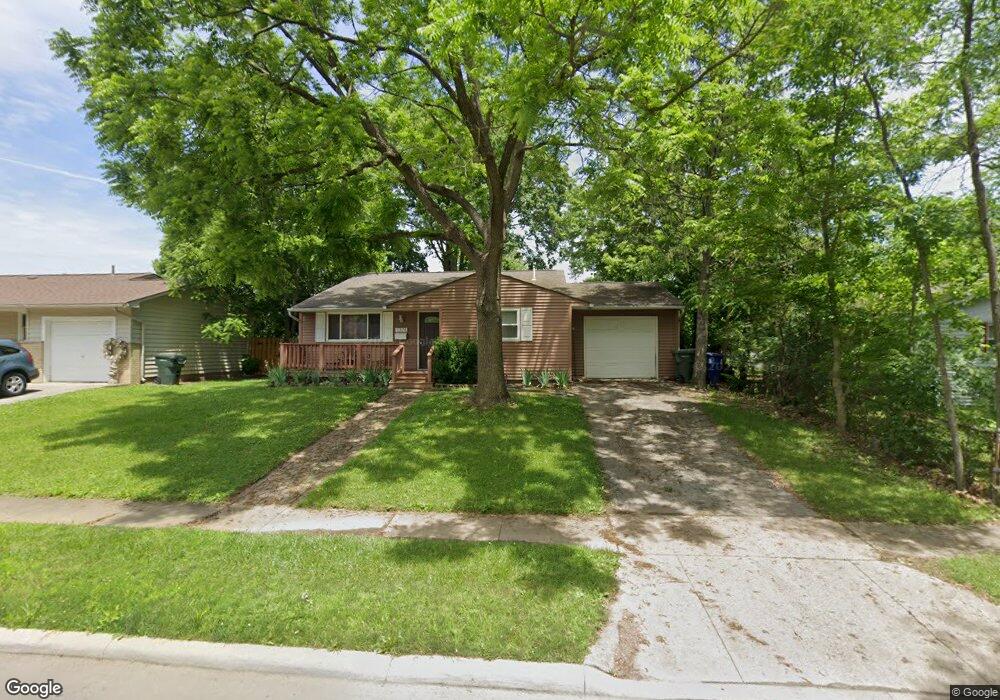
1374 Whitby Square S Columbus, OH 43229
Devonshire NeighborhoodEstimated Value: $241,000 - $286,000
3
Beds
3
Baths
1,470
Sq Ft
$174/Sq Ft
Est. Value
About This Home
This home is located at 1374 Whitby Square S, Columbus, OH 43229 and is currently estimated at $255,711, approximately $173 per square foot. 1374 Whitby Square S is a home located in Franklin County with nearby schools including Devonshire Alternative Elementary School, Woodward Park Middle School, and Beechcroft High School.
Ownership History
Date
Name
Owned For
Owner Type
Purchase Details
Closed on
Sep 19, 2019
Sold by
Mcclelland Darwin and Mcclelland Stephanie M
Bought by
3831 Fergus Road Llc
Current Estimated Value
Purchase Details
Closed on
Dec 26, 2007
Sold by
Hud
Bought by
Mcclelland Stephanie M and Mcclelland Darwin
Home Financials for this Owner
Home Financials are based on the most recent Mortgage that was taken out on this home.
Original Mortgage
$52,000
Interest Rate
6.17%
Mortgage Type
Purchase Money Mortgage
Purchase Details
Closed on
Sep 21, 2006
Sold by
Flavin Thomas W and Countrywide Home Loan Inc
Bought by
Hud
Purchase Details
Closed on
Dec 8, 1994
Sold by
Flavin Richard P
Bought by
Flavin Thomas W and Flavin Dale A
Home Financials for this Owner
Home Financials are based on the most recent Mortgage that was taken out on this home.
Original Mortgage
$72,249
Interest Rate
9.06%
Mortgage Type
FHA
Purchase Details
Closed on
Apr 1, 1986
Purchase Details
Closed on
Feb 1, 1986
Create a Home Valuation Report for This Property
The Home Valuation Report is an in-depth analysis detailing your home's value as well as a comparison with similar homes in the area
Home Values in the Area
Average Home Value in this Area
Purchase History
| Date | Buyer | Sale Price | Title Company |
|---|---|---|---|
| 3831 Fergus Road Llc | -- | None Available | |
| Mcclelland Stephanie M | $65,000 | None Available | |
| Hud | $80,000 | None Available | |
| Flavin Thomas W | $79,000 | -- | |
| -- | $48,600 | -- | |
| -- | $50,000 | -- |
Source: Public Records
Mortgage History
| Date | Status | Borrower | Loan Amount |
|---|---|---|---|
| Previous Owner | Mcclelland Stephanie M | $52,000 | |
| Previous Owner | Flavin Thomas W | $72,249 |
Source: Public Records
Tax History Compared to Growth
Tax History
| Year | Tax Paid | Tax Assessment Tax Assessment Total Assessment is a certain percentage of the fair market value that is determined by local assessors to be the total taxable value of land and additions on the property. | Land | Improvement |
|---|---|---|---|---|
| 2024 | $3,107 | $67,800 | $17,570 | $50,230 |
| 2023 | $3,068 | $67,795 | $17,570 | $50,225 |
| 2022 | $2,457 | $46,240 | $12,810 | $33,430 |
| 2021 | $2,462 | $46,240 | $12,810 | $33,430 |
| 2020 | $2,465 | $46,240 | $12,810 | $33,430 |
| 2019 | $2,309 | $37,140 | $10,260 | $26,880 |
| 2018 | $2,057 | $37,140 | $10,260 | $26,880 |
| 2017 | $2,147 | $37,140 | $10,260 | $26,880 |
| 2016 | $1,986 | $29,230 | $7,740 | $21,490 |
| 2015 | $1,808 | $29,230 | $7,740 | $21,490 |
| 2014 | $1,812 | $29,230 | $7,740 | $21,490 |
| 2013 | $993 | $32,480 | $8,610 | $23,870 |
Source: Public Records
Map
Nearby Homes
- 1288 Oakfield Dr N
- 5990 Ambleside Dr
- 6035 Karl Rd
- 6189 Northgap Dr
- 1549 Alpine Dr
- 1390 E Dublin Granville Rd
- 1171 Newbury Dr
- 6211 Parkdale Dr
- 1268 Kildale Ct
- 6407 Faircrest Rd
- 6342 Bellmeadow Dr
- 6458 Faircrest Rd
- 1409 Bosworth Place
- 1421 Bosworth Place
- 1752 Pine Tree St S Unit H
- 1743 Pine Tree St N Unit A
- 1492 Cottonwood Dr
- 1687 Brookfield Square S
- 1294 Clydesdale Ct
- 6407 Skywae Dr
- 1368 Whitby Square S
- 6125 Ambleside Dr
- 1377 Whitby Square N
- 1360 Whitby Square S
- 1363 Whitby Square N
- 6137 Ambleside Dr
- 1377 Whitby Square S
- 1357 Whitby Square N
- 6099 Ambleside Dr
- 1348 Whitby Square S
- 6122 Ambleside Dr
- 1359 Whitby Square S
- 1349 Whitby Square N
- 6138 Ambleside Dr
- 1347 Whitby Square S
- 6100 Ambleside Dr
- 1340 Whitby Square S
- 1414 Burnley Ct
- 1380 Whitby Square N
- 1339 Whitby Square S