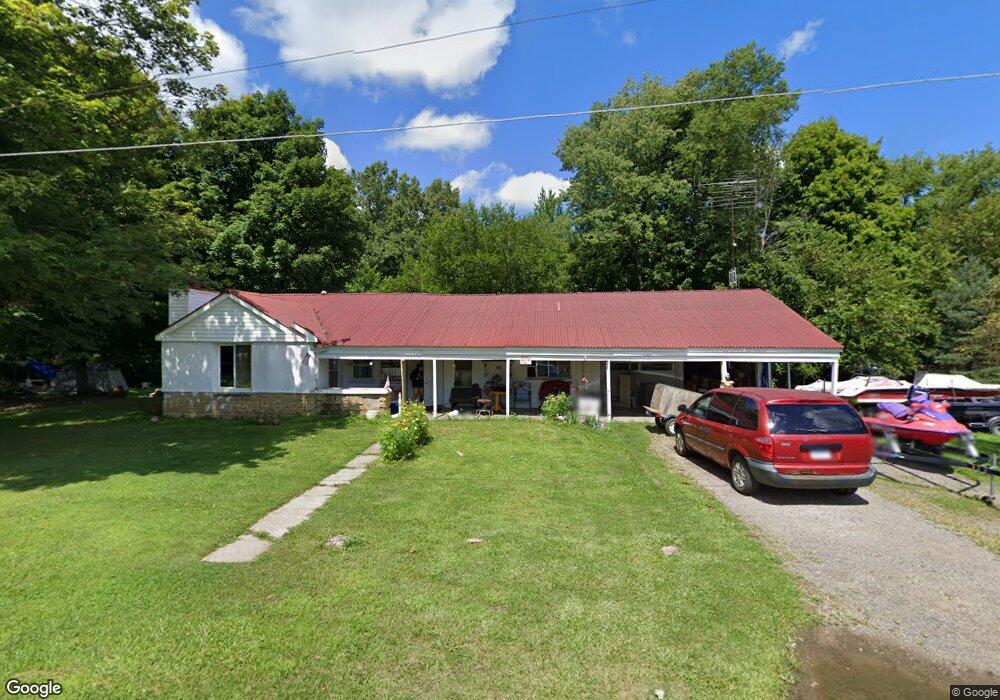
13748 Homer Rd Concord, MI 49237
Estimated Value: $160,000 - $314,000
--
Bed
--
Bath
1,063
Sq Ft
$195/Sq Ft
Est. Value
About This Home
This home is located at 13748 Homer Rd, Concord, MI 49237 and is currently estimated at $207,704, approximately $195 per square foot. 13748 Homer Rd is a home located in Jackson County with nearby schools including Concord Elementary School, Concord Middle School, and Concord High School.
Ownership History
Date
Name
Owned For
Owner Type
Purchase Details
Closed on
May 6, 2020
Sold by
Rimer Patricia and Couling Patricia
Bought by
Miller Alva Allen and Miller Megan Lynne
Current Estimated Value
Purchase Details
Closed on
Mar 5, 2015
Sold by
Rimer Patricia and Couling Patricia
Bought by
Miller Alva Allen and Miller Megan Lynne
Home Financials for this Owner
Home Financials are based on the most recent Mortgage that was taken out on this home.
Original Mortgage
$39,000
Interest Rate
3%
Mortgage Type
Seller Take Back
Purchase Details
Closed on
Mar 2, 2010
Sold by
Rimer Patricia
Bought by
Rimer Patricia
Purchase Details
Closed on
Oct 1, 2002
Sold by
Flack Cynthia M
Bought by
Rimer Richard C
Purchase Details
Closed on
Sep 8, 1980
Sold by
Keith Vilma J
Bought by
Keith Edward J
Purchase Details
Closed on
Jan 13, 1978
Sold by
Keith Vilma J
Bought by
Keith Edward J
Create a Home Valuation Report for This Property
The Home Valuation Report is an in-depth analysis detailing your home's value as well as a comparison with similar homes in the area
Home Values in the Area
Average Home Value in this Area
Purchase History
| Date | Buyer | Sale Price | Title Company |
|---|---|---|---|
| Miller Alva Allen | $39,000 | None Available | |
| Miller Alva Allen | $39,000 | At | |
| Rimer Patricia | -- | None Available | |
| Rimer Richard C | $37,000 | -- | |
| Keith Edward J | -- | -- | |
| Keith Edward J | -- | -- |
Source: Public Records
Mortgage History
| Date | Status | Borrower | Loan Amount |
|---|---|---|---|
| Previous Owner | Miller Alva Allen | $39,000 |
Source: Public Records
Tax History Compared to Growth
Tax History
| Year | Tax Paid | Tax Assessment Tax Assessment Total Assessment is a certain percentage of the fair market value that is determined by local assessors to be the total taxable value of land and additions on the property. | Land | Improvement |
|---|---|---|---|---|
| 2025 | $1,634 | $70,800 | $70,800 | $0 |
| 2024 | $552 | $67,500 | $67,500 | $0 |
| 2023 | $526 | $63,200 | $63,200 | $0 |
| 2022 | $1,484 | $56,200 | $56,200 | $0 |
| 2021 | $1,460 | $49,400 | $49,400 | $0 |
| 2020 | $1,445 | $46,400 | $0 | $0 |
| 2019 | $1,405 | $44,700 | $0 | $0 |
| 2018 | $1,373 | $41,000 | $0 | $0 |
| 2017 | $1,237 | $40,600 | $0 | $0 |
| 2016 | $449 | $40,000 | $40,000 | $0 |
| 2015 | -- | $35,900 | $35,900 | $0 |
| 2014 | -- | $38,050 | $0 | $0 |
| 2013 | -- | $38,050 | $38,050 | $0 |
Source: Public Records
Map
Nearby Homes
- 270 Wood Hills Dr
- 385 Wood Hills Dr
- 0 River Bend Drive Lot #11
- 0 River Bend Drive Lot #4
- 0 River Bend Drive Lot #3
- 0 River Bend Drive Lot #5
- 0 River Bend Drive Lot #9
- 0 River Bend Drive Lot #10
- 7210 Pulaski Rd Rd
- 229 S Concord St
- 209 Hanover St
- 5354 Albion Rd
- 516 Cecil Dr
- 0 Albion Rd
- 213 Railroad St
- 313 Michigan St
- 731 Sears Rd
- 0 River Bend Drive Lot #1
- 0 River Bend Drive Lot #2
- 6175 van Wert Rd
- 13618 Homer Rd
- 13747 Homer Rd
- 13605 Homer Rd
- 13880 Homer Rd
- 13800 Spring Arbor Rd
- 13610 Homer Rd
- 13946 Homer Rd
- 13510 Homer Rd
- 6740 Eckert Rd
- 6729 Eckert Rd
- 6750 Eckert Rd
- 14048 Homer Rd
- 0 Eckert Rd Unit 5458801
- 0 Eckert Rd Unit 5554897
- 0 Eckert Rd Unit 16032925
- 0 Eckert Rd Unit 17006761
- 0 Eckert Rd Unit M21039148
- 0 Eckert Rd Unit M21038636
- 14054 Homer Rd
- 6741 Eckert Rd