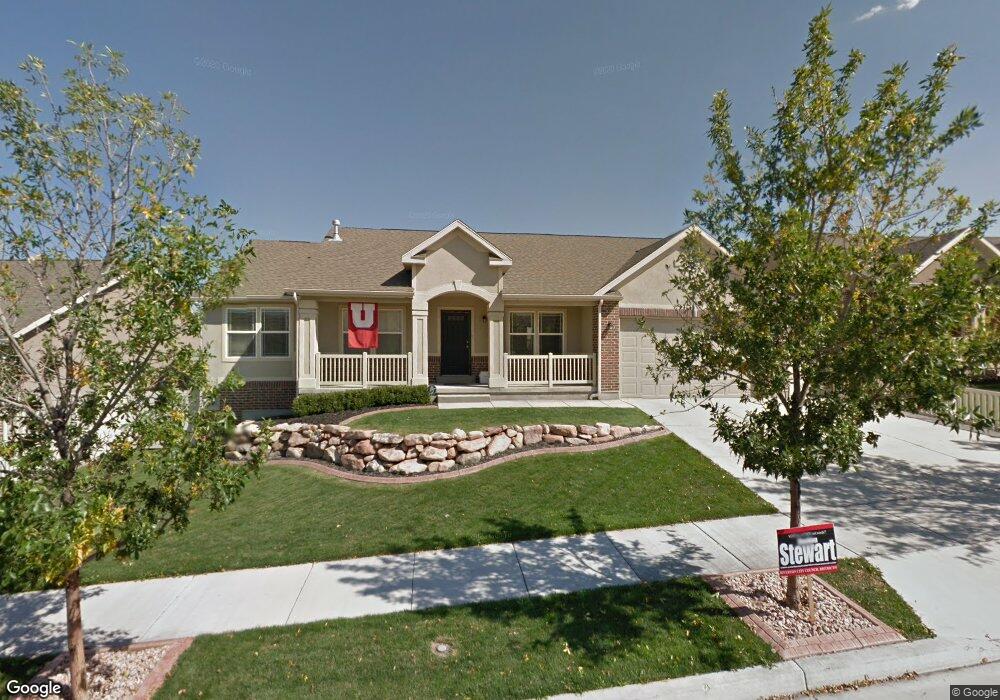
13749 S Bluewing Way Riverton, UT 84096
Estimated Value: $617,000 - $709,000
5
Beds
3
Baths
3,552
Sq Ft
$184/Sq Ft
Est. Value
About This Home
This home is located at 13749 S Bluewing Way, Riverton, UT 84096 and is currently estimated at $653,857, approximately $184 per square foot. 13749 S Bluewing Way is a home located in Salt Lake County with nearby schools including Foothills School, South Hills Middle School, and Mountain Ridge High School.
Ownership History
Date
Name
Owned For
Owner Type
Purchase Details
Closed on
Feb 25, 2019
Sold by
Jacobsmeyer Hugo A and Jacobsmeyer Marsha F
Bought by
Jacobsmeyer Hugo and Jacobsmeyer Marsha
Current Estimated Value
Purchase Details
Closed on
Apr 25, 2014
Sold by
Creager Matthew S and Creager Stephanie
Bought by
Jacobsmeyer Hugo A and Jacobsmeyer Marsha F
Home Financials for this Owner
Home Financials are based on the most recent Mortgage that was taken out on this home.
Original Mortgage
$205,000
Outstanding Balance
$152,303
Interest Rate
3.75%
Mortgage Type
Adjustable Rate Mortgage/ARM
Estimated Equity
$501,554
Purchase Details
Closed on
Apr 26, 2005
Sold by
Centex Homes
Bought by
Creager Matthew S and Creager Stephanie
Home Financials for this Owner
Home Financials are based on the most recent Mortgage that was taken out on this home.
Original Mortgage
$167,700
Interest Rate
5.92%
Mortgage Type
Fannie Mae Freddie Mac
Create a Home Valuation Report for This Property
The Home Valuation Report is an in-depth analysis detailing your home's value as well as a comparison with similar homes in the area
Home Values in the Area
Average Home Value in this Area
Purchase History
| Date | Buyer | Sale Price | Title Company |
|---|---|---|---|
| Jacobsmeyer Hugo | -- | None Available | |
| Jacobsmeyer Hugo A | -- | Cornerstone Title Ins Agcy L | |
| Creager Matthew S | -- | Equity Title |
Source: Public Records
Mortgage History
| Date | Status | Borrower | Loan Amount |
|---|---|---|---|
| Open | Jacobsmeyer Hugo A | $205,000 | |
| Previous Owner | Creager Matthew S | $167,700 |
Source: Public Records
Tax History Compared to Growth
Tax History
| Year | Tax Paid | Tax Assessment Tax Assessment Total Assessment is a certain percentage of the fair market value that is determined by local assessors to be the total taxable value of land and additions on the property. | Land | Improvement |
|---|---|---|---|---|
| 2025 | $3,533 | $630,500 | $131,900 | $498,600 |
| 2024 | $3,533 | $611,400 | $127,300 | $484,100 |
| 2023 | $3,481 | $568,000 | $111,700 | $456,300 |
| 2022 | $0 | $583,300 | $109,500 | $473,800 |
| 2021 | $3,140 | $447,500 | $84,300 | $363,200 |
| 2020 | $3,014 | $400,500 | $84,300 | $316,200 |
| 2019 | $2,978 | $389,000 | $84,300 | $304,700 |
| 2018 | $0 | $376,400 | $78,700 | $297,700 |
| 2017 | $2,881 | $361,100 | $78,700 | $282,400 |
| 2016 | $2,753 | $331,100 | $78,700 | $252,400 |
| 2015 | $2,764 | $322,300 | $81,300 | $241,000 |
| 2014 | $2,321 | $265,300 | $76,100 | $189,200 |
Source: Public Records
Map
Nearby Homes
- 5031 Greenstreak Dr
- 13908 S 5180 W
- 13597 S Firetip Ct
- 5087 W London Bay Dr
- 5217 Autumn Creek Dr
- 13492 Leaf Wing Ln
- 14054 Elk Horn Peak Dr
- 13863 S Kessler Peak Dr
- 14048 van Cott Peak Cir
- 13497 S Mimosa Cir
- 13397 S Alto Vista Ln
- 13377 S Vitasol Ln
- 13392 S Alto Vista Ln
- 4722 W Cillian Ln Unit 2411
- 4714 W Cillian Ln Unit 2410
- 4698 W Cillian Ln Unit 2409
- 13349 S Celestina Ln
- 5288 W Solafax Ln Unit 34-I
- 4688 W Cillian Ln Unit 2408
- 5149 W Arley Ct
- 13749 Bluewing Way
- 13739 Bluewing Way
- 13759 Bluewing Way
- 13748 Daggerwing Way
- 13748 S Daggerwing Way
- 13758 Daggerwing Way
- 13758 S Daggerwing Way
- 13738 Daggerwing Way
- 13738 S Daggerwing Way
- 13746 Bluewing Way
- 13746 S Bluewing Way
- 13771 Bluewing Way
- 13727 Bluewing Way
- 13756 S Bluewing Way
- 13756 Bluewing Way
- 13768 S Daggerwing Way
- 13736 Bluewing Way
- 13736 S Bluewing Way
- 13768 Daggerwing Way
- 13728 S Daggerwing Way