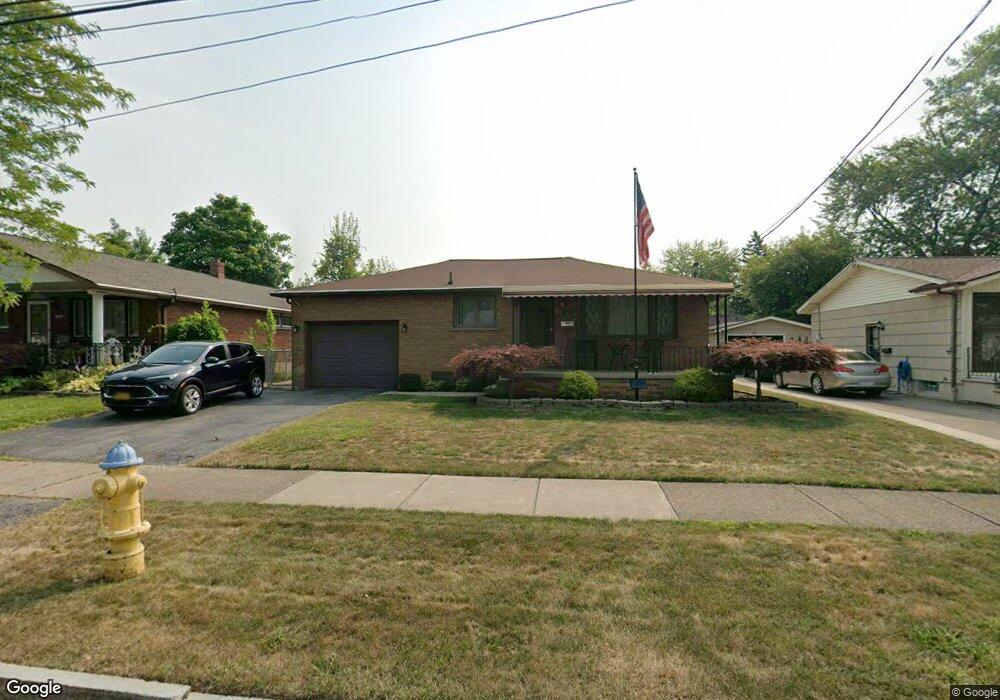
1375 101st St Niagara Falls, NY 14304
LaSalle NeighborhoodEstimated Value: $229,000 - $244,000
3
Beds
1
Bath
1,144
Sq Ft
$208/Sq Ft
Est. Value
About This Home
This home is located at 1375 101st St, Niagara Falls, NY 14304 and is currently estimated at $238,264, approximately $208 per square foot. 1375 101st St is a home located in Niagara County with nearby schools including Niagara Falls High School, Christ the King Preparatory Academy, and Catholic Academy Of Niagara Falls - Elementary.
Ownership History
Date
Name
Owned For
Owner Type
Purchase Details
Closed on
Jun 28, 2024
Sold by
Pappas Andrew D
Bought by
Forcucci Anthony Joseph
Current Estimated Value
Home Financials for this Owner
Home Financials are based on the most recent Mortgage that was taken out on this home.
Original Mortgage
$215,340
Outstanding Balance
$212,743
Interest Rate
6.94%
Mortgage Type
New Conventional
Estimated Equity
$25,521
Purchase Details
Closed on
Aug 24, 2009
Sold by
Wachob Jemima
Bought by
Pappas Andrew
Home Financials for this Owner
Home Financials are based on the most recent Mortgage that was taken out on this home.
Original Mortgage
$90,333
Interest Rate
5.19%
Mortgage Type
FHA
Purchase Details
Closed on
Aug 13, 2009
Sold by
Wachob J Grace and Burnett Catherine
Bought by
Pappas Andrew D
Home Financials for this Owner
Home Financials are based on the most recent Mortgage that was taken out on this home.
Original Mortgage
$90,333
Interest Rate
5.19%
Mortgage Type
FHA
Create a Home Valuation Report for This Property
The Home Valuation Report is an in-depth analysis detailing your home's value as well as a comparison with similar homes in the area
Home Values in the Area
Average Home Value in this Area
Purchase History
| Date | Buyer | Sale Price | Title Company |
|---|---|---|---|
| Forcucci Anthony Joseph | $222,000 | None Listed On Document | |
| Pappas Andrew | $92,000 | Jeffrey Mis | |
| Pappas Andrew D | $92,000 | None Available |
Source: Public Records
Mortgage History
| Date | Status | Borrower | Loan Amount |
|---|---|---|---|
| Open | Forcucci Anthony Joseph | $215,340 | |
| Previous Owner | Pappas Andrew D | $90,333 |
Source: Public Records
Tax History Compared to Growth
Tax History
| Year | Tax Paid | Tax Assessment Tax Assessment Total Assessment is a certain percentage of the fair market value that is determined by local assessors to be the total taxable value of land and additions on the property. | Land | Improvement |
|---|---|---|---|---|
| 2024 | $3,471 | $79,900 | $8,600 | $71,300 |
| 2023 | $3,471 | $79,900 | $8,600 | $71,300 |
| 2022 | $2,337 | $79,900 | $8,600 | $71,300 |
| 2021 | $2,337 | $79,900 | $8,600 | $71,300 |
| 2020 | $1,551 | $79,900 | $8,600 | $71,300 |
| 2019 | $1,488 | $79,900 | $8,600 | $71,300 |
| 2018 | $2,296 | $79,900 | $8,600 | $71,300 |
| 2017 | $1,488 | $79,900 | $8,600 | $71,300 |
| 2016 | $2,232 | $79,900 | $8,600 | $71,300 |
| 2015 | -- | $79,900 | $8,600 | $71,300 |
| 2014 | -- | $79,900 | $8,600 | $71,300 |
Source: Public Records
Map
Nearby Homes