Estimated Value: $103,745 - $146,000
3
Beds
2
Baths
1,568
Sq Ft
$76/Sq Ft
Est. Value
About This Home
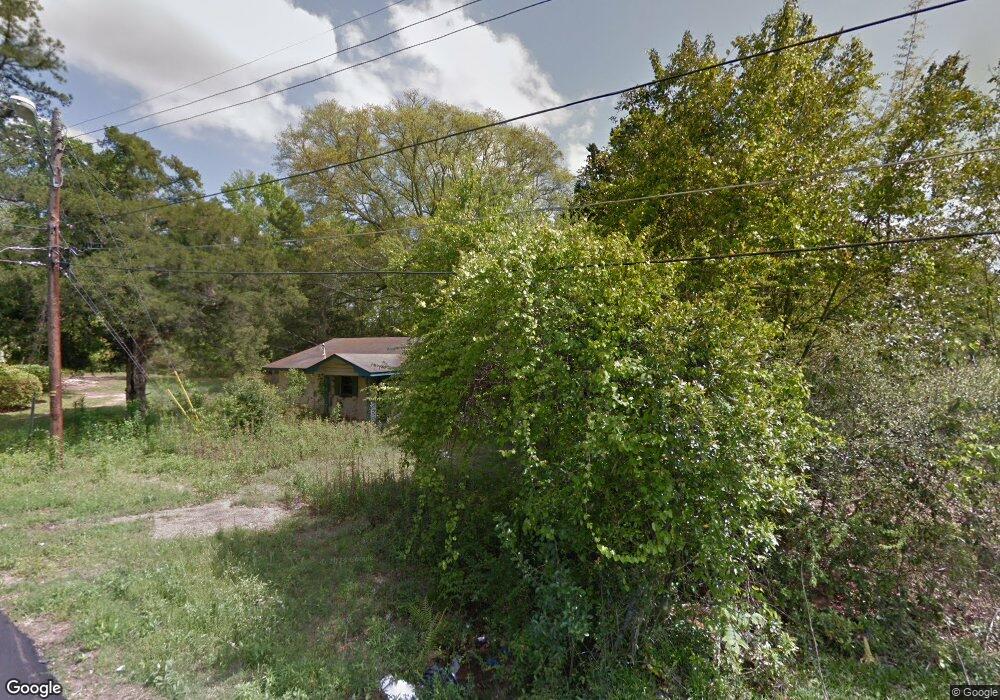
This home is located at 1375 3rd Ave SW, Cairo, GA 39828 and is currently estimated at $118,436, approximately $75 per square foot. 1375 3rd Ave SW is a home located in Grady County with nearby schools including Cairo High School.
Ownership History
Date
Name
Owned For
Owner Type
Purchase Details
Closed on
Feb 8, 2013
Sold by
Hill Jacqueline
Bought by
Murkerson Larry O
Current Estimated Value
Purchase Details
Closed on
Mar 11, 2010
Sold by
Bearden Ray Lauren
Bought by
Bearden Ray Lauren and Bearden Twila W
Purchase Details
Closed on
Sep 1, 2009
Sold by
Sandefur Keith P
Bought by
Bain Bernard
Purchase Details
Closed on
Sep 19, 2002
Sold by
Thomas Timmy
Bought by
Hill Angela
Purchase Details
Closed on
Dec 4, 2001
Sold by
Prince Terry
Bought by
Thomas Timmy
Purchase Details
Closed on
Jul 3, 2001
Sold by
Thomas Timmy
Bought by
Prince Terry
Purchase Details
Closed on
Nov 24, 1999
Sold by
Thomas Timmy
Bought by
Thomas Timmy
Purchase Details
Closed on
May 24, 1996
Sold by
Hunter Calvin
Bought by
Thomas Timmy
Purchase Details
Closed on
Mar 14, 1996
Sold by
Fann Danny G
Bought by
Hunter Calvin
Purchase Details
Closed on
Oct 30, 1987
Bought by
Fann Danny G
Create a Home Valuation Report for This Property
The Home Valuation Report is an in-depth analysis detailing your home's value as well as a comparison with similar homes in the area
Purchase History
| Date | Buyer | Sale Price | Title Company |
|---|---|---|---|
| Murkerson Larry O | $4,000 | -- | |
| Murkerson Larry O | -- | -- | |
| Bearden Ray Lauren | -- | -- | |
| Bain Bernard | -- | -- | |
| Hill Angela | $900 | -- | |
| Thomas Timmy | $800 | -- | |
| Prince Terry | $300 | -- | |
| Thomas Timmy | $50,000 | -- | |
| Thomas Timmy | $43,300 | -- | |
| Hunter Calvin | $25,500 | -- | |
| Fann Danny G | $31,000 | -- |
Source: Public Records
Tax History
| Year | Tax Paid | Tax Assessment Tax Assessment Total Assessment is a certain percentage of the fair market value that is determined by local assessors to be the total taxable value of land and additions on the property. | Land | Improvement |
|---|---|---|---|---|
| 2025 | $1,252 | $48,928 | $2,640 | $46,288 |
| 2024 | $1,252 | $43,600 | $2,640 | $40,960 |
| 2023 | $125 | $3,380 | $2,180 | $1,200 |
| 2022 | $130 | $3,380 | $2,180 | $1,200 |
| 2021 | $130 | $3,380 | $2,180 | $1,200 |
| 2020 | $131 | $3,380 | $2,180 | $1,200 |
| 2019 | $131 | $3,380 | $2,180 | $1,200 |
| 2018 | $124 | $3,380 | $2,180 | $1,200 |
| 2017 | $120 | $3,380 | $2,180 | $1,200 |
| 2016 | $122 | $3,380 | $2,180 | $1,200 |
| 2015 | $121 | $3,380 | $2,180 | $1,200 |
| 2014 | $57 | $3,380 | $2,180 | $1,200 |
| 2013 | -- | $3,380 | $2,180 | $1,200 |
Source: Public Records
Map
Nearby Homes
- 000 1st Ave SW
- 0 Georgia 111
- 320 8th St SW
- 460 2nd St SW
- 00 10th Avenue N W
- 112 Pine Cir SW
- 117 SW Pine Cirlce
- 1327 Rest St SW
- X 1st St
- 0 1st St
- 000 S Broad St
- 125 6th Ave NW
- 220 8th Ave NW
- 303 4th Ave SE
- 00 Lake Douglas
- Lot 27 W Lake Dr
- 909 4th St NW
- 1293 McQuaig St NW
- 698 12th Ave NW
- 309 3rd St SE
- 521 Hunter St
- 595 Westbrooks St SW
- 515 Hunter St
- 400 13th St SW
- 514 Hunter St
- 464 Hunter St
- 403 Westbrooks St SW
- 464 Hunter Ave
- 1423 3rd Ave SW
- 1410 3rd Ave SW
- 475 Hunter St
- 1467 Mlk jr Ave SW
- 1425 4th Ave SW
- 457 Lewis St SW
- 1480 4th Ave SW
- 645 Westbrooks St SW
- 1385 Martin Luther King jr Ave SW
- 1385 Martin Luther King Junior Ave
- 615 15th St SW
- 1325 Martin Luther King jr Ave SW
Your Personal Tour Guide
Ask me questions while you tour the home.