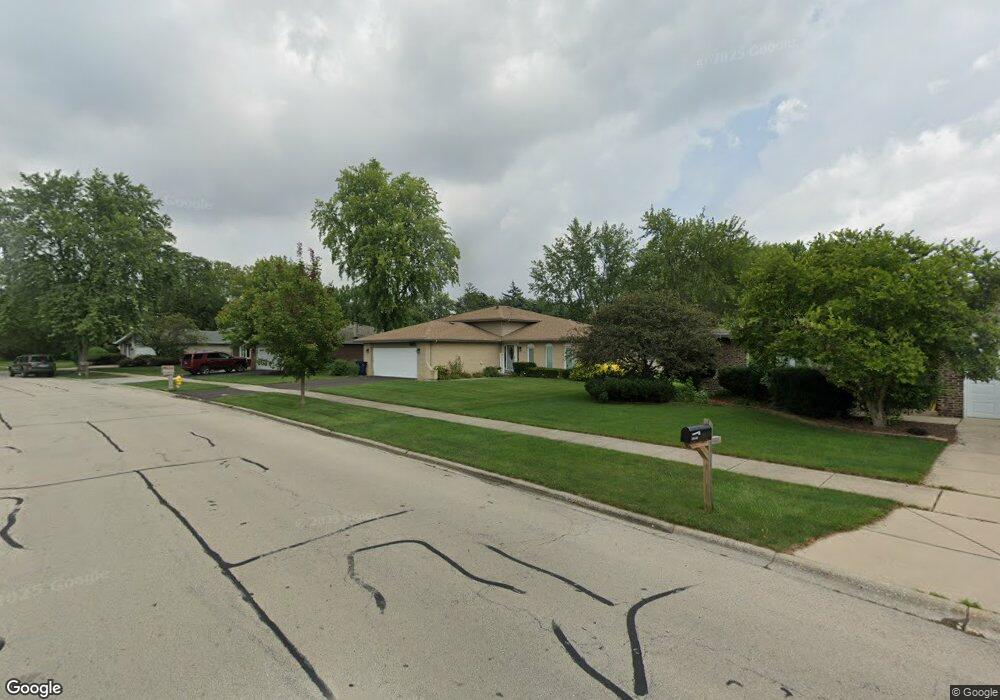
13751 S 84th Ave Orland Park, IL 60462
Silver Lake North NeighborhoodEstimated Value: $372,000 - $427,000
3
Beds
2
Baths
1,327
Sq Ft
$304/Sq Ft
Est. Value
About This Home
This home is located at 13751 S 84th Ave, Orland Park, IL 60462 and is currently estimated at $403,038, approximately $303 per square foot. 13751 S 84th Ave is a home located in Cook County with nearby schools including Prairie Elementary School, Liberty Elementary School, and Jerling Junior High School.
Ownership History
Date
Name
Owned For
Owner Type
Purchase Details
Closed on
Jun 15, 2017
Sold by
Gregory Jason and Gregory Michelle
Bought by
Faridi Daniel and Spatafore Joscelyn
Current Estimated Value
Home Financials for this Owner
Home Financials are based on the most recent Mortgage that was taken out on this home.
Original Mortgage
$232,000
Outstanding Balance
$193,502
Interest Rate
4.12%
Mortgage Type
New Conventional
Estimated Equity
$209,536
Purchase Details
Closed on
Aug 5, 2010
Sold by
Chicago Title Land Trust Company
Bought by
Gregory Jason and Gregory Michelle
Home Financials for this Owner
Home Financials are based on the most recent Mortgage that was taken out on this home.
Original Mortgage
$209,700
Interest Rate
4.26%
Mortgage Type
New Conventional
Purchase Details
Closed on
Mar 17, 1994
Sold by
Watters Richard H and Watters Jean A
Bought by
First National Bank Of Evergreen Park
Create a Home Valuation Report for This Property
The Home Valuation Report is an in-depth analysis detailing your home's value as well as a comparison with similar homes in the area
Home Values in the Area
Average Home Value in this Area
Purchase History
| Date | Buyer | Sale Price | Title Company |
|---|---|---|---|
| Faridi Daniel | $290,000 | Old Republic Title | |
| Gregory Jason | $233,000 | Chicago Title Land Trust Co | |
| First National Bank Of Evergreen Park | -- | -- |
Source: Public Records
Mortgage History
| Date | Status | Borrower | Loan Amount |
|---|---|---|---|
| Open | Faridi Daniel | $232,000 | |
| Previous Owner | Gregory Jason | $209,700 |
Source: Public Records
Tax History Compared to Growth
Tax History
| Year | Tax Paid | Tax Assessment Tax Assessment Total Assessment is a certain percentage of the fair market value that is determined by local assessors to be the total taxable value of land and additions on the property. | Land | Improvement |
|---|---|---|---|---|
| 2024 | $7,499 | $31,130 | $5,412 | $25,718 |
| 2023 | $5,253 | $35,001 | $5,412 | $29,589 |
| 2022 | $5,253 | $20,956 | $4,674 | $16,282 |
| 2021 | $5,099 | $20,955 | $4,673 | $16,282 |
| 2020 | $4,971 | $20,955 | $4,673 | $16,282 |
| 2019 | $5,488 | $23,423 | $4,181 | $19,242 |
| 2018 | $6,253 | $23,423 | $4,181 | $19,242 |
| 2017 | $6,706 | $29,076 | $4,181 | $24,895 |
| 2016 | $5,603 | $22,576 | $3,689 | $18,887 |
| 2015 | $5,514 | $22,576 | $3,689 | $18,887 |
| 2014 | $5,447 | $22,576 | $3,689 | $18,887 |
| 2013 | $5,202 | $22,925 | $3,689 | $19,236 |
Source: Public Records
Map
Nearby Homes
- 13623 S 84th Ave
- 8115 Pluskota Dr
- 14023 Chelsea Dr
- 13550 86th Ave
- 8132 Pickens Dr
- 8005 Trafalgar Ct
- 14040 Boxwood Ln
- 8134 Uxbridge Dr
- 8820 W 140th St Unit 2A
- Richmond Plan at Misty Meadow
- Dartmore Plan at Misty Meadow
- Compton Plan at Misty Meadow
- Beaumont Plan at Misty Meadow
- Barrington Plan at Misty Meadow
- 13315 Strawberry Ln
- 8932 Pebble Beach Ln
- 8841 Briarwood Ln
- 8700 Berkley Ct
- 8756 Butterfield Ln
- 8309 W 132nd St
- 13757 S 84th Ave
- 13745 S 84th Ave
- 13739 S 84th Ave
- 13750 S 84th Ave
- 13724 83rd Ct
- 13756 S 84th Ave
- 13801 S 84th Ave
- 13742 S 84th Ave
- 13712 83rd Ct
- 13731 S 84th Ave
- 13708 83rd Ct
- 8341 83rd Ct
- 8407 Orenia Ct
- 13807 S 84th Ave
- 8407 Spruce Dr
- 8416 Spruce Dr
- 8415 Orenia Ct
- 13723 S 84th Ave
- 13648 83rd Ct
- 8423 Orenia Ct