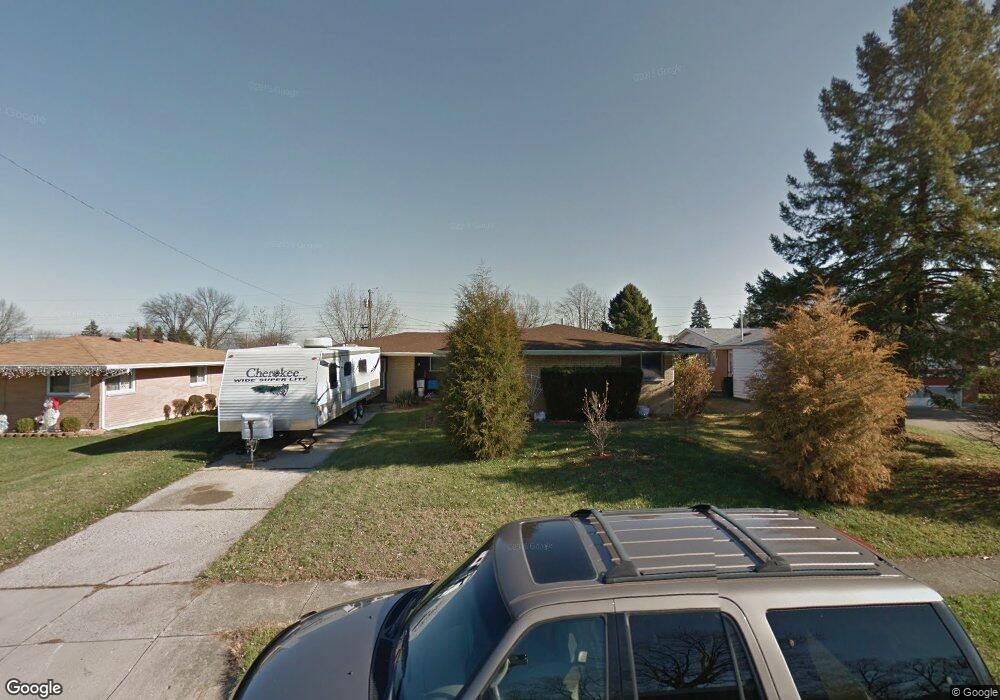
1376 Maplegrove Dr Fairborn, OH 45324
Estimated Value: $210,477 - $220,000
3
Beds
2
Baths
1,414
Sq Ft
$151/Sq Ft
Est. Value
About This Home
This home is located at 1376 Maplegrove Dr, Fairborn, OH 45324 and is currently estimated at $214,119, approximately $151 per square foot. 1376 Maplegrove Dr is a home located in Greene County with nearby schools including Fairborn Primary School, Fairborn Intermediate School, and Fairborn Middle School.
Ownership History
Date
Name
Owned For
Owner Type
Purchase Details
Closed on
Oct 11, 2017
Sold by
Hud
Bought by
Thompson Daniel E
Current Estimated Value
Purchase Details
Closed on
Oct 5, 2016
Sold by
Huntington Natl Bank
Bought by
U S A Secy Of H & U Devel
Home Financials for this Owner
Home Financials are based on the most recent Mortgage that was taken out on this home.
Interest Rate
3.5%
Purchase Details
Closed on
Sep 21, 2016
Bought by
Huntington National Bank
Home Financials for this Owner
Home Financials are based on the most recent Mortgage that was taken out on this home.
Interest Rate
3.5%
Purchase Details
Closed on
Apr 30, 2004
Sold by
Frisby Robert J and Hall Debra Y
Bought by
Green Elwyn F and Green Jennifer A
Home Financials for this Owner
Home Financials are based on the most recent Mortgage that was taken out on this home.
Original Mortgage
$96,790
Interest Rate
5.5%
Mortgage Type
FHA
Purchase Details
Closed on
May 21, 2001
Sold by
Frisby Robert J
Bought by
Frisby Robert J and Hall Debra Y
Create a Home Valuation Report for This Property
The Home Valuation Report is an in-depth analysis detailing your home's value as well as a comparison with similar homes in the area
Home Values in the Area
Average Home Value in this Area
Purchase History
| Date | Buyer | Sale Price | Title Company |
|---|---|---|---|
| Thompson Daniel E | -- | -- | |
| U S A Secy Of H & U Devel | -- | None Available | |
| Huntington National Bank | $50,000 | -- | |
| Green Elwyn F | $98,000 | -- | |
| Frisby Robert J | -- | -- |
Source: Public Records
Mortgage History
| Date | Status | Borrower | Loan Amount |
|---|---|---|---|
| Previous Owner | Huntington National Bank | -- | |
| Previous Owner | Green Elwyn F | $96,790 |
Source: Public Records
Tax History
| Year | Tax Paid | Tax Assessment Tax Assessment Total Assessment is a certain percentage of the fair market value that is determined by local assessors to be the total taxable value of land and additions on the property. | Land | Improvement |
|---|---|---|---|---|
| 2024 | $2,728 | $56,550 | $10,500 | $46,050 |
| 2023 | $2,708 | $56,550 | $10,500 | $46,050 |
| 2022 | $2,045 | $35,940 | $8,080 | $27,860 |
| 2021 | $2,075 | $35,940 | $8,080 | $27,860 |
| 2020 | $2,104 | $35,940 | $8,080 | $27,860 |
| 2019 | $1,645 | $28,380 | $8,000 | $20,380 |
| 2018 | $1,662 | $28,380 | $8,000 | $20,380 |
| 2017 | $1,621 | $28,380 | $8,000 | $20,380 |
| 2016 | $1,621 | $28,380 | $8,000 | $20,380 |
| 2015 | $1,634 | $28,380 | $8,000 | $20,380 |
| 2014 | $1,582 | $28,380 | $8,000 | $20,380 |
Source: Public Records
Map
Nearby Homes
- 1878 Wildflower Rd
- 1408 Mapleridge Dr
- 1463 Maplegrove Dr
- 135 E Garland Ave
- 1267 Beech St
- 0 W Garland Ave
- 201 State St
- 1222 Hemlock Dr
- 1108 Lexington Ave
- 239-241 Euclid Ave
- 256 Euclid Ave
- 349 Forest St
- 45 Regina Dr
- 38 Lindway Dr
- Lot 4 W Dayton-Yellow Springs Rd
- Lot 3 W Dayton-Yellow Springs Rd
- 1531-1533 Miami Ave
- 14 Forestdale Ave
- 1728-1730 Wilbur Ave
- 818 Flintridge Dr
- 1372 Maplegrove Dr
- 1380 Maplegrove Dr
- 1368 Maplegrove Dr
- 1384 Maplegrove Dr
- 1377 Mapleridge Dr
- 1381 Mapleridge Dr
- 1373 Mapleridge Dr
- 1377 Maplegrove Dr
- 1369 Mapleridge Dr
- 1364 Maplegrove Dr
- 1385 Mapleridge Dr
- 1388 Maplegrove Dr
- 1381 Maplegrove Dr
- 1369 Maplegrove Dr
- 1385 Maplegrove Dr
- 1365 Mapleridge Dr
- 1389 Mapleridge Dr
- 1392 Maplegrove Dr
- 1360 Maplegrove Dr
- 1365 Maplegrove Dr
Your Personal Tour Guide
Ask me questions while you tour the home.