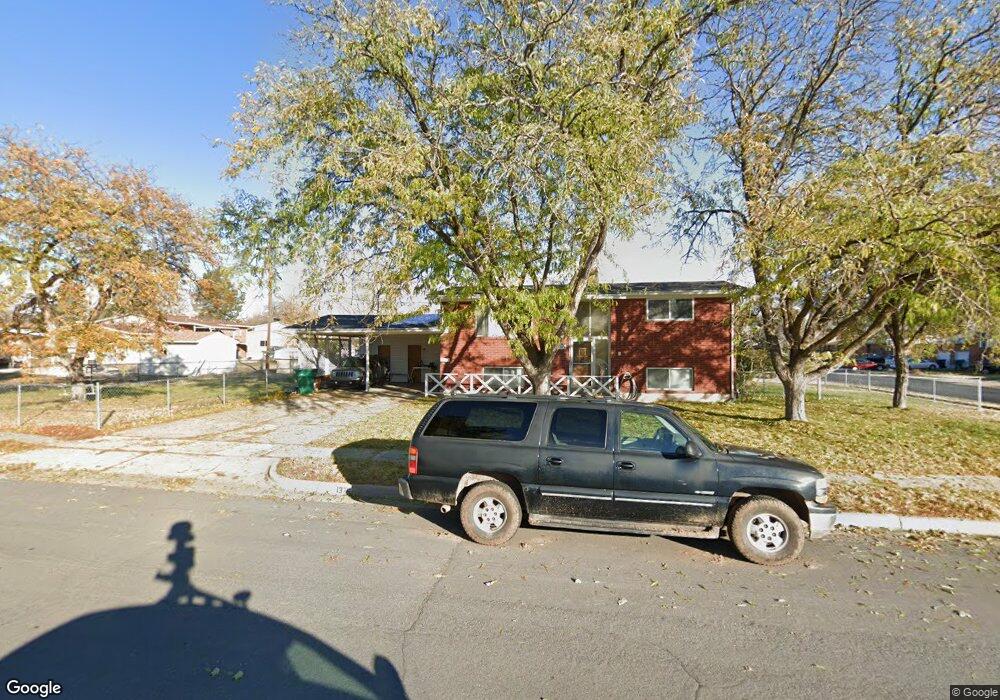
1376 N 350 W Layton, UT 84041
Estimated Value: $414,000 - $428,694
3
Beds
2
Baths
1,950
Sq Ft
$214/Sq Ft
Est. Value
About This Home
This home is located at 1376 N 350 W, Layton, UT 84041 and is currently estimated at $418,174, approximately $214 per square foot. 1376 N 350 W is a home located in Davis County with nearby schools including Crestview Elementary School, Central Davis Junior High School, and Northridge High School.
Ownership History
Date
Name
Owned For
Owner Type
Purchase Details
Closed on
Nov 16, 2020
Sold by
Day Robert M and Day Rebecca M
Bought by
Day Robert M and Day Rebecca M
Current Estimated Value
Home Financials for this Owner
Home Financials are based on the most recent Mortgage that was taken out on this home.
Original Mortgage
$110,000
Outstanding Balance
$88,758
Interest Rate
2.8%
Mortgage Type
New Conventional
Estimated Equity
$329,416
Purchase Details
Closed on
Mar 10, 2016
Sold by
Clark Alex and Clark Brittney
Bought by
Day Robert M and Day Rebecca M
Purchase Details
Closed on
Aug 22, 2011
Sold by
Clark Alex
Bought by
Clark Alex and Clark Brittney
Home Financials for this Owner
Home Financials are based on the most recent Mortgage that was taken out on this home.
Original Mortgage
$120,650
Interest Rate
4.53%
Mortgage Type
New Conventional
Purchase Details
Closed on
Feb 26, 2007
Sold by
Bushak Edward S and Bushak Margaret Ann
Bought by
Bushak Edward S and Bushak Margaret
Create a Home Valuation Report for This Property
The Home Valuation Report is an in-depth analysis detailing your home's value as well as a comparison with similar homes in the area
Home Values in the Area
Average Home Value in this Area
Purchase History
| Date | Buyer | Sale Price | Title Company |
|---|---|---|---|
| Day Robert M | -- | Integrated Title Insu | |
| Day Robert M | -- | Integrated Title | |
| Clark Alex | -- | Accommodation | |
| Clark Alex | -- | First American Title | |
| Bushak Edward S | -- | None Available | |
| Bushak Edward S | -- | None Available |
Source: Public Records
Mortgage History
| Date | Status | Borrower | Loan Amount |
|---|---|---|---|
| Open | Day Robert M | $110,000 | |
| Previous Owner | Clark Alex | $120,650 |
Source: Public Records
Tax History Compared to Growth
Tax History
| Year | Tax Paid | Tax Assessment Tax Assessment Total Assessment is a certain percentage of the fair market value that is determined by local assessors to be the total taxable value of land and additions on the property. | Land | Improvement |
|---|---|---|---|---|
| 2025 | $1,844 | $193,600 | $105,791 | $87,809 |
| 2024 | $1,774 | $187,549 | $122,711 | $64,838 |
| 2023 | $1,706 | $174,900 | $77,459 | $97,440 |
| 2022 | $1,701 | $313,000 | $138,104 | $174,896 |
| 2021 | $1,616 | $244,000 | $110,618 | $133,382 |
| 2020 | $1,471 | $213,000 | $91,348 | $121,652 |
| 2019 | $1,481 | $210,000 | $85,214 | $124,786 |
| 2018 | $1,313 | $187,000 | $85,214 | $101,786 |
| 2016 | $1,167 | $85,745 | $28,335 | $57,410 |
| 2015 | $1,095 | $76,340 | $28,335 | $48,005 |
| 2014 | $954 | $68,052 | $28,335 | $39,717 |
| 2013 | -- | $73,413 | $24,816 | $48,597 |
Source: Public Records
Map
Nearby Homes
- 1490 N 175 W
- 103 W 1275 N
- 1096 N 300 W
- 1715 N Alder St
- 1583 N 25 E
- 398 Paul Ave
- 1180 N 100 E
- 1837 N 440 W
- 975 N Garnet St
- 1553 N 250 E
- 1908 N 200 W
- 324 E 1325 N
- 1474 N 285 E
- 1366 N Main St Unit 5
- 2053 Evans Cove Loop Unit 39
- 2048 Evans Cove Loop
- 1500 N Angel St Unit 12
- 1187 W Seraphim Ct
- 9 W 2150 N
- 506 W 2200 N