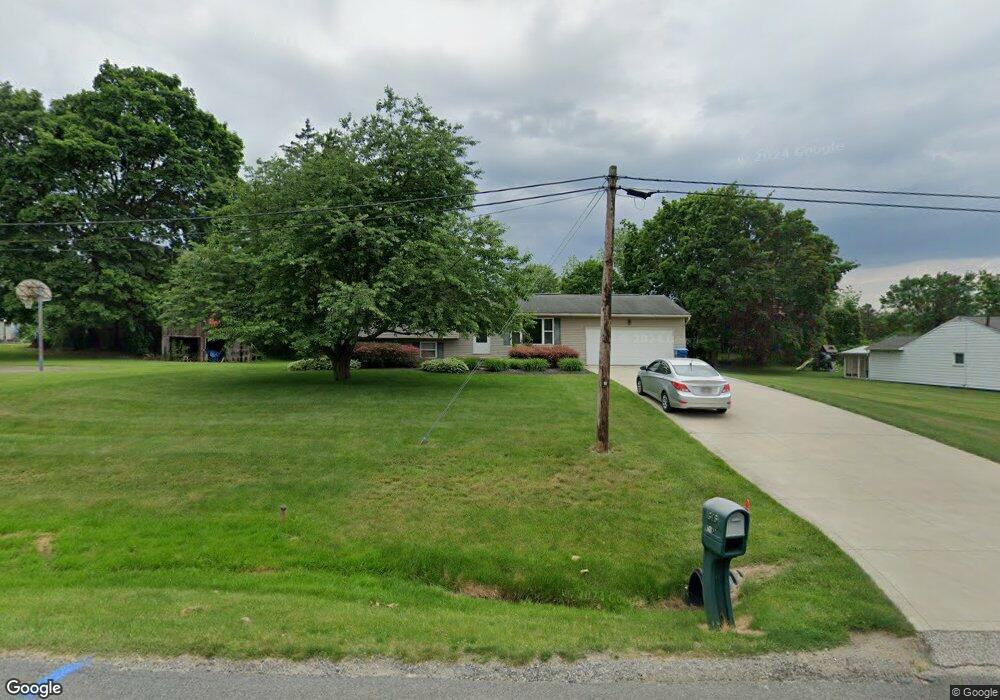
1376 N Plainview Dr Copley, OH 44321
Estimated Value: $277,000 - $286,000
3
Beds
2
Baths
1,232
Sq Ft
$227/Sq Ft
Est. Value
About This Home
This home is located at 1376 N Plainview Dr, Copley, OH 44321 and is currently estimated at $279,777, approximately $227 per square foot. 1376 N Plainview Dr is a home located in Summit County with nearby schools including Copley-Fairlawn Middle School, Copley High School, and Spring Garden Waldorf School.
Ownership History
Date
Name
Owned For
Owner Type
Purchase Details
Closed on
Oct 7, 2005
Sold by
Anderson Holly A and Anderson Eric B
Bought by
Couch Jarrod A and Couch Madelyn
Current Estimated Value
Home Financials for this Owner
Home Financials are based on the most recent Mortgage that was taken out on this home.
Original Mortgage
$128,000
Outstanding Balance
$68,813
Interest Rate
5.83%
Mortgage Type
Fannie Mae Freddie Mac
Estimated Equity
$210,964
Purchase Details
Closed on
Nov 10, 2001
Sold by
Acker Richard H and Acker Rosemary
Bought by
Anderson Holly A
Create a Home Valuation Report for This Property
The Home Valuation Report is an in-depth analysis detailing your home's value as well as a comparison with similar homes in the area
Home Values in the Area
Average Home Value in this Area
Purchase History
| Date | Buyer | Sale Price | Title Company |
|---|---|---|---|
| Couch Jarrod A | $160,000 | Real Estate Title Examining | |
| Anderson Holly A | $6,000 | -- |
Source: Public Records
Mortgage History
| Date | Status | Borrower | Loan Amount |
|---|---|---|---|
| Open | Couch Jarrod A | $128,000 |
Source: Public Records
Tax History
| Year | Tax Paid | Tax Assessment Tax Assessment Total Assessment is a certain percentage of the fair market value that is determined by local assessors to be the total taxable value of land and additions on the property. | Land | Improvement |
|---|---|---|---|---|
| 2024 | $4,339 | $82,037 | $12,170 | $69,867 |
| 2023 | $4,339 | $82,037 | $12,170 | $69,867 |
| 2022 | $4,049 | $62,720 | $9,289 | $53,431 |
| 2021 | $3,735 | $62,720 | $9,289 | $53,431 |
| 2020 | $3,646 | $62,720 | $9,290 | $53,430 |
| 2019 | $3,184 | $49,400 | $8,830 | $40,570 |
| 2018 | $3,027 | $49,400 | $8,830 | $40,570 |
| 2017 | $2,596 | $49,400 | $8,830 | $40,570 |
| 2016 | $2,592 | $40,680 | $8,830 | $31,850 |
| 2015 | $2,596 | $40,680 | $8,830 | $31,850 |
| 2014 | $2,578 | $40,680 | $8,830 | $31,850 |
| 2013 | $2,988 | $47,830 | $8,830 | $39,000 |
Source: Public Records
Map
Nearby Homes
- 1273 Meadow Run
- 0 Aberth Dr
- 1121 Meadow Run
- 1489 Sunnyacres Rd
- 2941 Copley Rd
- 2773 Mull Ave
- 864 Kirkwall Dr Unit 47E
- 2950 Colon Dr
- 2973 Colon Dr
- 0 Schocalog Rd Unit 5155850
- 1161 Magdalyn Dr
- 1772 Lakeland Ave
- 2038 Waycross Ave
- 897 Bellaire Dr
- 2858 Orchard Grove Ct
- 3241 Ridgewood Rd
- 147 Quaker Ridge Dr
- 2939 Greenspire Ln
- V/L - 6 Acres Ridgewood Rd
- V/L White Tail Ridge Dr
- 1366 N Plainview Dr
- 2665 Copley Rd
- 1387 Meadow Run
- 1391 Meadow Run
- 1383 Meadow Run
- 1379 Meadow Run
- 1375 Meadow Run
- 1371 Meadow Run
- 1356 N Plainview Dr
- 1372 Meadow Run
- 1359 Meadow Run
- 1368 Meadow Run
- 1346 N Plainview Dr
- 1364 Meadow Run
- 1360 Meadow Run
- 1355 Meadow Run
- 1355 N Plainview Dr
- 1352 Meadow Run
- 1347 Meadow Run
- 1338 Meadow Run