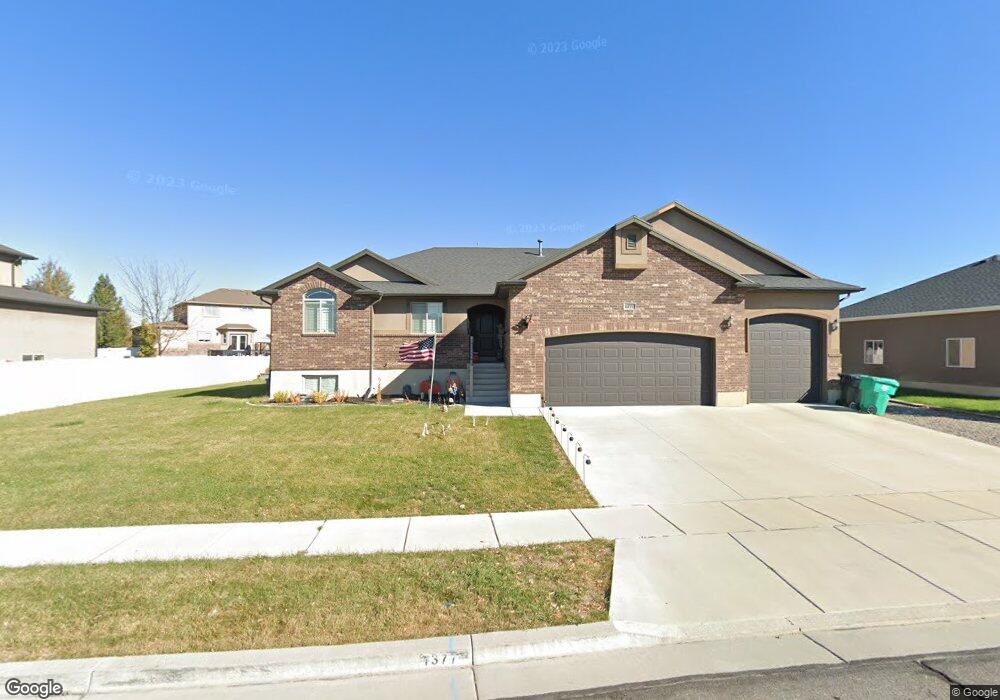
1377 S 4225 W Unit 527 Syracuse, UT 84075
Estimated Value: $570,000 - $642,000
3
Beds
2
Baths
1,500
Sq Ft
$402/Sq Ft
Est. Value
About This Home
This home is located at 1377 S 4225 W Unit 527, Syracuse, UT 84075 and is currently estimated at $602,862, approximately $401 per square foot. 1377 S 4225 W Unit 527 is a home located in Davis County with nearby schools including Buffalo Point School, Syracuse Junior High School, and Syracuse High School.
Ownership History
Date
Name
Owned For
Owner Type
Purchase Details
Closed on
Apr 6, 2013
Sold by
Castle Creek Homes Lc
Bought by
Evertsen Gearith T and Evertsen Lindsay M
Current Estimated Value
Home Financials for this Owner
Home Financials are based on the most recent Mortgage that was taken out on this home.
Original Mortgage
$244,000
Outstanding Balance
$172,184
Interest Rate
3.54%
Mortgage Type
Purchase Money Mortgage
Estimated Equity
$430,678
Purchase Details
Closed on
Oct 3, 2011
Sold by
Wells Fargo Bank National Association
Bought by
Castle Creek Homes Llc
Home Financials for this Owner
Home Financials are based on the most recent Mortgage that was taken out on this home.
Original Mortgage
$1,233,750
Interest Rate
4.05%
Mortgage Type
Purchase Money Mortgage
Purchase Details
Closed on
Apr 7, 2009
Sold by
Us Development Inc
Bought by
Wells Fargo Bank National Association
Create a Home Valuation Report for This Property
The Home Valuation Report is an in-depth analysis detailing your home's value as well as a comparison with similar homes in the area
Home Values in the Area
Average Home Value in this Area
Purchase History
| Date | Buyer | Sale Price | Title Company |
|---|---|---|---|
| Evertsen Gearith T | -- | Mountain View Title & | |
| Castle Creek Homes Llc | -- | First American Title | |
| Wells Fargo Bank National Association | -- | None Available |
Source: Public Records
Mortgage History
| Date | Status | Borrower | Loan Amount |
|---|---|---|---|
| Open | Evertsen Gearith T | $244,000 | |
| Previous Owner | Castle Creek Homes Llc | $1,233,750 |
Source: Public Records
Tax History Compared to Growth
Tax History
| Year | Tax Paid | Tax Assessment Tax Assessment Total Assessment is a certain percentage of the fair market value that is determined by local assessors to be the total taxable value of land and additions on the property. | Land | Improvement |
|---|---|---|---|---|
| 2025 | $2,982 | $287,651 | $111,150 | $176,501 |
| 2024 | $2,859 | $277,749 | $90,416 | $187,333 |
| 2023 | $2,667 | $259,600 | $74,557 | $185,042 |
| 2022 | $2,987 | $527,000 | $125,140 | $401,860 |
| 2021 | $2,597 | $390,000 | $100,230 | $289,770 |
| 2020 | $2,324 | $338,000 | $81,815 | $256,185 |
| 2019 | $2,264 | $325,000 | $85,138 | $239,862 |
| 2018 | $2,077 | $296,000 | $82,509 | $213,491 |
| 2016 | $1,947 | $145,475 | $34,176 | $111,299 |
| 2015 | $1,908 | $135,795 | $34,176 | $101,619 |
| 2014 | $1,836 | $133,175 | $34,176 | $98,999 |
| 2013 | -- | $45,000 | $45,000 | $0 |
Source: Public Records
Map
Nearby Homes
- 4191 W 1425 S
- 1238 S 4290 W
- 3951 Baltimore Cir
- 1084 S 4090 W
- 1157 S 4425 W
- 3882 Turnberry Dr
- 1039 S 4250 W
- 3867 Rungsted Cir
- 1155 S 4475 W
- 1139 S 4475 W
- Bradford Plan at Harvest Fields
- Avery Plan at Harvest Fields
- Sullivan Plan at Harvest Fields
- Presley Plan at Harvest Fields
- Ashmore Plan at Harvest Fields
- Bridgeport Plan at Harvest Fields
- Malan Plan at Harvest Fields
- Havenwood Plan at Harvest Fields
- Hamilton Plan at Harvest Fields
- Havenwood with Loft Plan at Harvest Fields
- 1393 S 4225 W Unit 526
- 1363 S 4225 W Unit 528
- 1378 S 4175 W Unit 522
- 1378 S 4175 W
- 1348 S 4185 W
- 1390 S 4225 W Unit 537
- 1394 S 4175 W
- 1394 S 4175 W Unit 523
- 1374 S 4225 W Unit 536
- 1345 S 4225 W Unit 529
- 1410 S 4225 W Unit 538
- 1410 S 4225 W
- 1342 S 4185 W
- 1409 S 4225 W Unit 525
- 1412 S 4175 W Unit 524
- 1351 S 4185 W
- 1358 S 4225 W Unit 535
- 1358 S 4225 W
- 1369 S 4175 W Unit 521
- 1337 S 4225 W Unit 530