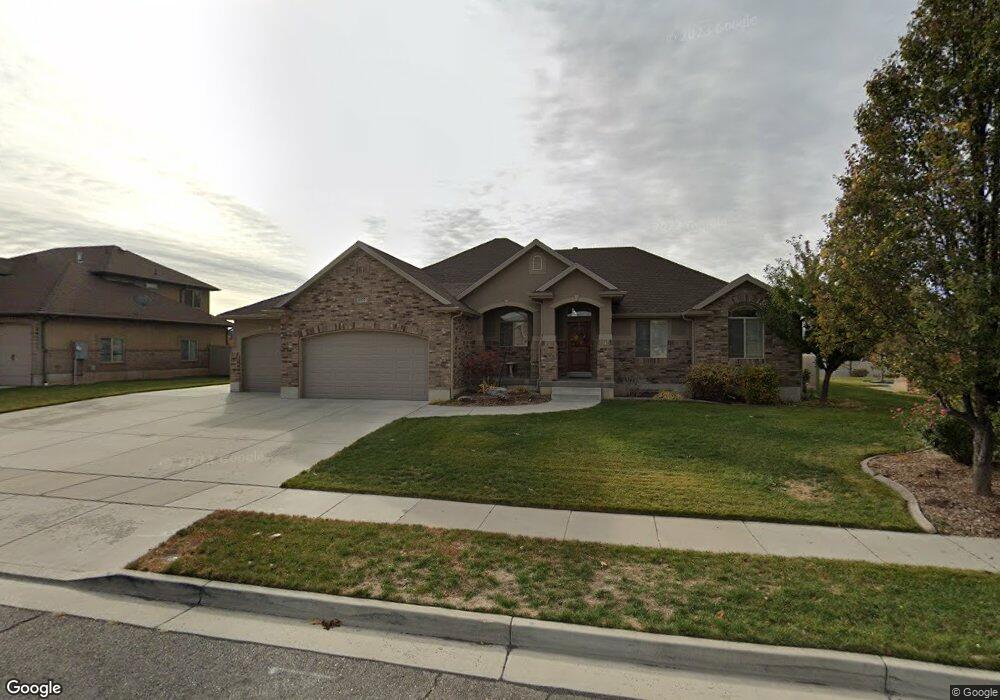
1377 W 2050 S Syracuse, UT 84075
Estimated Value: $640,000 - $787,000
6
Beds
4
Baths
3,694
Sq Ft
$192/Sq Ft
Est. Value
About This Home
This home is located at 1377 W 2050 S, Syracuse, UT 84075 and is currently estimated at $707,576, approximately $191 per square foot. 1377 W 2050 S is a home located in Davis County with nearby schools including Cook School, Legacy Junior High School, and Clearfield High School.
Ownership History
Date
Name
Owned For
Owner Type
Purchase Details
Closed on
Jul 22, 2016
Sold by
Fausett Bry and Fausett Koriann
Bought by
Meacham Franciska R
Current Estimated Value
Purchase Details
Closed on
Oct 5, 2006
Sold by
Scott Shepherd Construction Llc
Bought by
Fausett Bry and Fausett Koriann
Home Financials for this Owner
Home Financials are based on the most recent Mortgage that was taken out on this home.
Original Mortgage
$65,100
Interest Rate
6.12%
Mortgage Type
Stand Alone Second
Purchase Details
Closed on
Feb 3, 2006
Sold by
Shepherd Scott R and Shepherd Scott
Bought by
Scott Shepherd Construction Llc
Purchase Details
Closed on
Nov 15, 2005
Sold by
Thr Investments Llc
Bought by
Shepherd Scott
Create a Home Valuation Report for This Property
The Home Valuation Report is an in-depth analysis detailing your home's value as well as a comparison with similar homes in the area
Home Values in the Area
Average Home Value in this Area
Purchase History
| Date | Buyer | Sale Price | Title Company |
|---|---|---|---|
| Meacham Franciska R | -- | Security Title | |
| Fausett Bry | -- | Bonneville Superior Title Co | |
| Scott Shepherd Construction Llc | -- | Accommodation | |
| Shepherd Scott | -- | Bonneville Title Company |
Source: Public Records
Mortgage History
| Date | Status | Borrower | Loan Amount |
|---|---|---|---|
| Previous Owner | Fausett Bry | $65,100 | |
| Previous Owner | Fausett Bry | $260,400 |
Source: Public Records
Tax History Compared to Growth
Tax History
| Year | Tax Paid | Tax Assessment Tax Assessment Total Assessment is a certain percentage of the fair market value that is determined by local assessors to be the total taxable value of land and additions on the property. | Land | Improvement |
|---|---|---|---|---|
| 2025 | $3,785 | $365,200 | $126,836 | $238,364 |
| 2024 | $3,567 | $346,500 | $106,708 | $239,792 |
| 2023 | $3,356 | $594,000 | $148,580 | $445,420 |
| 2022 | $3,531 | $342,650 | $85,279 | $257,371 |
| 2021 | $3,136 | $471,000 | $126,230 | $344,770 |
| 2020 | $2,799 | $407,000 | $109,052 | $297,948 |
| 2019 | $2,682 | $385,000 | $107,705 | $277,295 |
| 2018 | $2,505 | $357,000 | $103,421 | $253,579 |
| 2016 | $2,364 | $176,660 | $39,654 | $137,006 |
| 2015 | $2,512 | $178,750 | $39,654 | $139,096 |
| 2014 | $2,088 | $151,466 | $39,654 | $111,812 |
| 2013 | -- | $170,353 | $39,764 | $130,589 |
Source: Public Records
Map
Nearby Homes