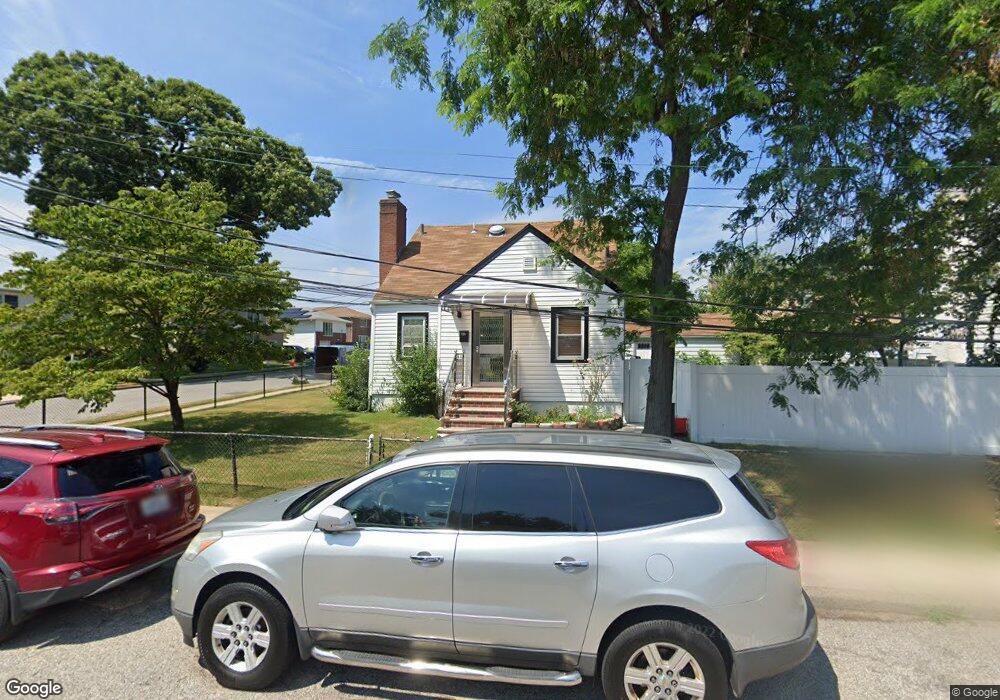
1378 D St Elmont, NY 11003
Estimated Value: $607,000 - $721,000
Studio
1
Bath
1,140
Sq Ft
$580/Sq Ft
Est. Value
About This Home
This home is located at 1378 D St, Elmont, NY 11003 and is currently estimated at $661,128, approximately $579 per square foot. 1378 D St is a home located in Nassau County with nearby schools including Cheder at the Ohel.
Ownership History
Date
Name
Owned For
Owner Type
Purchase Details
Closed on
Oct 13, 2009
Sold by
Us Bank National Association
Bought by
Duver Stephanie and Duver Nizar Lamour
Current Estimated Value
Home Financials for this Owner
Home Financials are based on the most recent Mortgage that was taken out on this home.
Original Mortgage
$236,521
Interest Rate
5.25%
Mortgage Type
FHA
Purchase Details
Closed on
May 12, 2009
Sold by
Us Bank National Association
Bought by
Us Bank National Association
Purchase Details
Closed on
May 11, 1999
Sold by
David William I
Bought by
Enea Joseph and Enea Bonnie
Purchase Details
Closed on
Jul 9, 1997
Sold by
Arena Jsoephine and Arena Atnhony
Bought by
Enca Bonnie and Enca Jospeh
Create a Home Valuation Report for This Property
The Home Valuation Report is an in-depth analysis detailing your home's value as well as a comparison with similar homes in the area
Home Values in the Area
Average Home Value in this Area
Purchase History
| Date | Buyer | Sale Price | Title Company |
|---|---|---|---|
| Duver Stephanie | -- | -- | |
| Us Bank National Association | $437,325 | None Available | |
| Enea Joseph | -- | -- | |
| Enca Bonnie | $156,000 | -- |
Source: Public Records
Mortgage History
| Date | Status | Borrower | Loan Amount |
|---|---|---|---|
| Previous Owner | Duver Stephanie | $236,521 |
Source: Public Records
Tax History
| Year | Tax Paid | Tax Assessment Tax Assessment Total Assessment is a certain percentage of the fair market value that is determined by local assessors to be the total taxable value of land and additions on the property. | Land | Improvement |
|---|---|---|---|---|
| 2025 | $11,053 | $460 | $258 | $202 |
| 2024 | $3,958 | $460 | $258 | $202 |
| 2023 | $10,648 | $460 | $258 | $202 |
| 2022 | $10,648 | $460 | $258 | $202 |
| 2021 | $14,573 | $439 | $246 | $193 |
| 2020 | $11,454 | $786 | $567 | $219 |
| 2019 | $11,881 | $786 | $567 | $219 |
| 2017 | $6,343 | $786 | $567 | $219 |
| 2016 | $10,199 | $786 | $567 | $219 |
| 2015 | $3,245 | $712 | $567 | $145 |
| 2014 | $3,245 | $712 | $567 | $145 |
| 2013 | $3,042 | $712 | $567 | $145 |
Source: Public Records
Map
Nearby Homes
- 1377 D St
- 1366 E St
- 494 Keller Ave
- 525 Keller Ave
- 1361 Star Ave
- 431 Kirkman Ave
- 1332 A St
- 1371 Rosser Ave
- 389 Kirkman Ave
- 562 Arcadian Ave
- 642 Dorothea Ln
- 1471 Rosser Ave
- 1326 Citizen Ave
- 389 Hunnewell Ave
- 1260 Bretton Rd
- 335 Evans Ave
- 1311 Mcclure Ave
- 645 Wyngate Dr W
- 247 Oakley Ave
- 1304 Appeal Ave
Your Personal Tour Guide
Ask me questions while you tour the home.