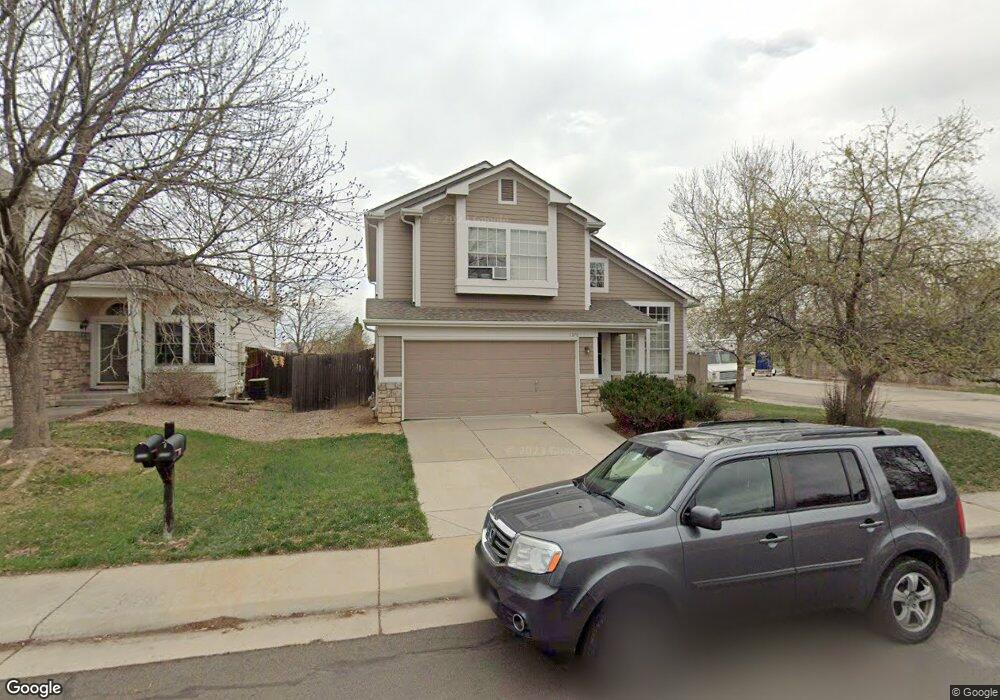
1378 Marigold Ct Lafayette, CO 80026
Estimated Value: $714,844 - $823,000
4
Beds
3
Baths
2,754
Sq Ft
$286/Sq Ft
Est. Value
About This Home
This home is located at 1378 Marigold Ct, Lafayette, CO 80026 and is currently estimated at $788,211, approximately $286 per square foot. 1378 Marigold Ct is a home located in Boulder County with nearby schools including Ryan Elementary School, Angevine Middle School, and Centaurus High School.
Ownership History
Date
Name
Owned For
Owner Type
Purchase Details
Closed on
Nov 14, 2012
Sold by
Orme Leonard G and Orme Pamela C
Bought by
Canyon Property Lllp
Current Estimated Value
Purchase Details
Closed on
Jul 23, 2001
Sold by
Smestad Timothy D and Smestad Samara D
Bought by
Orme Leonard G and Orme Pamela C
Purchase Details
Closed on
Jun 29, 1998
Sold by
Hanley Jeffrey and Hanley Karen
Bought by
Smestad Timothy D
Home Financials for this Owner
Home Financials are based on the most recent Mortgage that was taken out on this home.
Original Mortgage
$162,000
Interest Rate
7.13%
Purchase Details
Closed on
Feb 2, 1996
Sold by
Edwards Ted W and Edwards Bonnie L
Bought by
Hanley Jeffrey
Home Financials for this Owner
Home Financials are based on the most recent Mortgage that was taken out on this home.
Original Mortgage
$146,250
Interest Rate
7.19%
Purchase Details
Closed on
Aug 16, 1993
Bought by
Canyon Property Lllp
Create a Home Valuation Report for This Property
The Home Valuation Report is an in-depth analysis detailing your home's value as well as a comparison with similar homes in the area
Home Values in the Area
Average Home Value in this Area
Purchase History
| Date | Buyer | Sale Price | Title Company |
|---|---|---|---|
| Canyon Property Lllp | -- | None Available | |
| Orme Leonard G | $268,000 | -- | |
| Smestad Timothy D | $180,000 | Land Title | |
| Hanley Jeffrey | $162,500 | Land Title | |
| Canyon Property Lllp | -- | -- |
Source: Public Records
Mortgage History
| Date | Status | Borrower | Loan Amount |
|---|---|---|---|
| Previous Owner | Smestad Timothy D | $162,000 | |
| Previous Owner | Hanley Jeffrey | $146,250 |
Source: Public Records
Tax History Compared to Growth
Tax History
| Year | Tax Paid | Tax Assessment Tax Assessment Total Assessment is a certain percentage of the fair market value that is determined by local assessors to be the total taxable value of land and additions on the property. | Land | Improvement |
|---|---|---|---|---|
| 2025 | $4,136 | $45,344 | $15,113 | $30,231 |
| 2024 | $4,136 | $45,344 | $15,113 | $30,231 |
| 2023 | $4,065 | $46,672 | $15,115 | $35,242 |
| 2022 | $3,433 | $36,543 | $11,801 | $24,742 |
| 2021 | $3,395 | $37,595 | $12,141 | $25,454 |
| 2020 | $3,123 | $34,170 | $9,724 | $24,446 |
| 2019 | $3,080 | $34,170 | $9,724 | $24,446 |
| 2018 | $2,817 | $30,852 | $9,360 | $21,492 |
| 2017 | $2,742 | $34,109 | $10,348 | $23,761 |
| 2016 | $2,521 | $27,462 | $7,482 | $19,980 |
| 2015 | $2,363 | $23,037 | $6,050 | $16,987 |
| 2014 | $1,992 | $23,037 | $6,050 | $16,987 |
Source: Public Records
Map
Nearby Homes
- 1418 Marigold Dr
- 1198 Milo Cir Unit A
- 1053 Delta Dr Unit B
- 1191 Milo Cir Unit A
- 1065 Delta Dr Unit A
- 1045 Milo Cir Unit A
- 1068 Milo Cir Unit A
- 1091 Milo Cir Unit B
- 998 Milo Cir Unit A
- 1115 Bacchus Dr Unit 1
- 924 Milo Cir Unit A
- 911 Homer Cir
- 1116 Elysian Field Dr Unit F
- 1111 Elysian Field Dr Unit D
- 880 Orion Dr
- 805 Argos Cir
- 910 Sparta Dr
- 299 Cheyenne Dr
- 725 Julian Cir
- 718 Julian Cir
- 1372 Marigold Ct
- 1368 Marigold Ct
- 1402 Marigold Dr
- 881 Lilac Place
- 1362 Marigold Ct
- 1408 Marigold Dr
- 1010 Delta Dr
- 880 Lilac Place
- 1358 Marigold Ct
- 1012 Delta Dr
- 875 Lilac Place
- 1014 Delta Dr
- 879 Lilac Place
- 1352 Marigold Ct
- 1415 Marigold Dr
- 1422 Marigold Dr
- 876 Lilac Place
- 878 Lilac Place
- 1016 Delta Dr
- 903 Jasmine Place