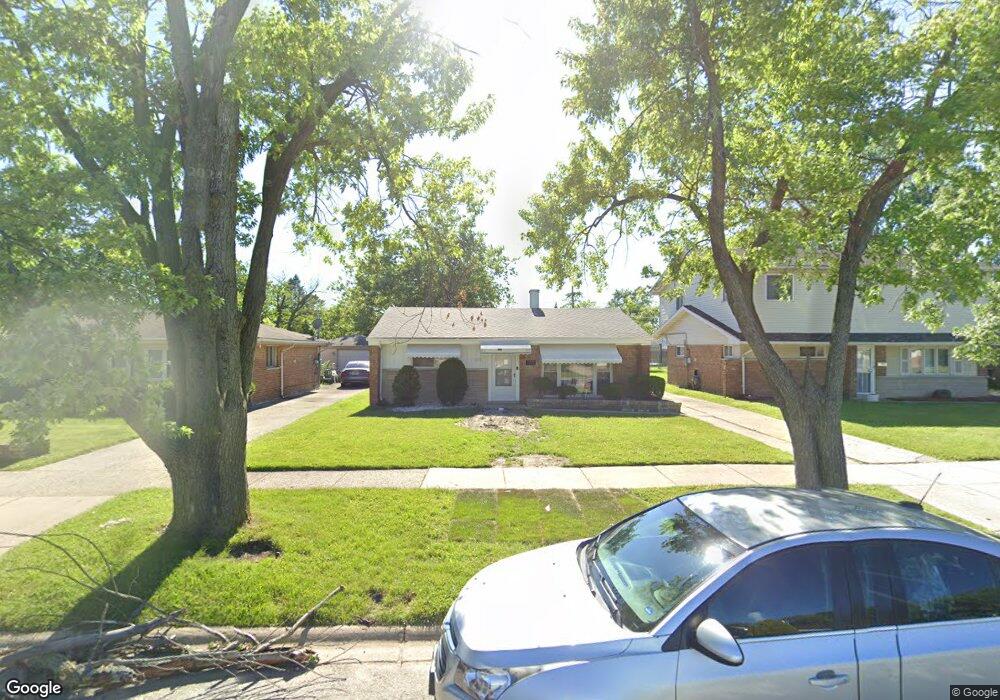
1378 Price Ave Calumet City, IL 60409
Estimated Value: $176,000 - $200,000
3
Beds
2
Baths
1,581
Sq Ft
$119/Sq Ft
Est. Value
About This Home
This home is located at 1378 Price Ave, Calumet City, IL 60409 and is currently estimated at $188,070, approximately $118 per square foot. 1378 Price Ave is a home located in Cook County with nearby schools including Hoover Elementary School, Schrum Memorial Middle School, and Thornton Fractional North High School.
Ownership History
Date
Name
Owned For
Owner Type
Purchase Details
Closed on
Dec 11, 2018
Sold by
Bmr Properties Llc
Bought by
Bmr Properties Llc 1378 Price
Current Estimated Value
Purchase Details
Closed on
Feb 6, 2012
Sold by
Lpp Mortgage Ltd
Bought by
Bmr Properties Llc
Purchase Details
Closed on
May 26, 2011
Sold by
Morales Angel and Morales Angel
Bought by
Lpp Mortgage Ltd
Purchase Details
Closed on
Sep 15, 2000
Sold by
Richardson Marian and Richardson Kinma
Bought by
Morales Angel
Home Financials for this Owner
Home Financials are based on the most recent Mortgage that was taken out on this home.
Original Mortgage
$88,850
Interest Rate
8.05%
Purchase Details
Closed on
Nov 9, 1998
Sold by
Kaminski Lorraine M
Bought by
Richardson Kinma and Richardson James B
Home Financials for this Owner
Home Financials are based on the most recent Mortgage that was taken out on this home.
Original Mortgage
$77,812
Interest Rate
6.68%
Mortgage Type
FHA
Create a Home Valuation Report for This Property
The Home Valuation Report is an in-depth analysis detailing your home's value as well as a comparison with similar homes in the area
Home Values in the Area
Average Home Value in this Area
Purchase History
| Date | Buyer | Sale Price | Title Company |
|---|---|---|---|
| Bmr Properties Llc 1378 Price | -- | None Available | |
| Bmr Properties Llc | $18,000 | Fidelity National Title | |
| Lpp Mortgage Ltd | -- | None Available | |
| Morales Angel | $89,000 | -- | |
| Richardson Kinma | $78,000 | -- |
Source: Public Records
Mortgage History
| Date | Status | Borrower | Loan Amount |
|---|---|---|---|
| Previous Owner | Morales Angel | $88,850 | |
| Previous Owner | Richardson Kinma | $77,812 |
Source: Public Records
Tax History Compared to Growth
Tax History
| Year | Tax Paid | Tax Assessment Tax Assessment Total Assessment is a certain percentage of the fair market value that is determined by local assessors to be the total taxable value of land and additions on the property. | Land | Improvement |
|---|---|---|---|---|
| 2024 | $8,549 | $13,000 | $2,635 | $10,365 |
| 2023 | $6,551 | $13,000 | $2,635 | $10,365 |
| 2022 | $6,551 | $7,684 | $2,325 | $5,359 |
| 2021 | $6,428 | $7,683 | $2,325 | $5,358 |
| 2020 | $5,429 | $7,683 | $2,325 | $5,358 |
| 2019 | $6,827 | $9,182 | $2,170 | $7,012 |
| 2018 | $4,299 | $9,182 | $2,170 | $7,012 |
| 2017 | $4,126 | $9,182 | $2,170 | $7,012 |
| 2016 | $3,153 | $7,175 | $2,015 | $5,160 |
| 2015 | $3,022 | $7,175 | $2,015 | $5,160 |
| 2014 | $2,941 | $7,175 | $2,015 | $5,160 |
| 2013 | $2,834 | $7,428 | $2,015 | $5,413 |
Source: Public Records
Map
Nearby Homes
- 1387 Price Ave
- 1366 Price Ave
- 1351 Gordon Ave
- 1395 Freeland Ave
- 1354 Hirsch Ave
- 1341 Gordon Ave
- 1354 Stanley Blvd
- 1404 Burnham Ave
- 1433 Burnham Ave
- 1373 Stanley Blvd
- 1401 Stanley Blvd
- 1383 Greenbay Ave
- 1313 Gordon Ave
- 1455 Burnham Ave
- 1375 Forest Place
- 1494 Stanley Blvd
- 305 River Oaks Dr
- 1295 Greenbay Ave
- 1317 Mackinaw Ave
- 1481 Lincoln Place
- 1382 Price Ave
- 1374 Price Ave
- 1370 Price Ave
- 1379 Hirsch Ave
- 1390 Price Ave
- 1383 Hirsch Ave
- 1375 Hirsch Ave
- 1387 Hirsch Ave
- 1371 Hirsch Ave
- 1379 Price Ave
- 1394 Price Ave
- 1383 Price Ave
- 1362 Price Ave
- 1391 Hirsch Ave
- 1371 Price Ave
- 1395 Hirsch Ave
- 1367 Price Ave
- 1391 Price Ave
- 1363 Hirsch Ave
- 1358 Price Ave