1379 E Hudson St Columbus, OH 43211
South Linden NeighborhoodEstimated Value: $120,000 - $166,000
2
Beds
1
Bath
939
Sq Ft
$144/Sq Ft
Est. Value
About This Home
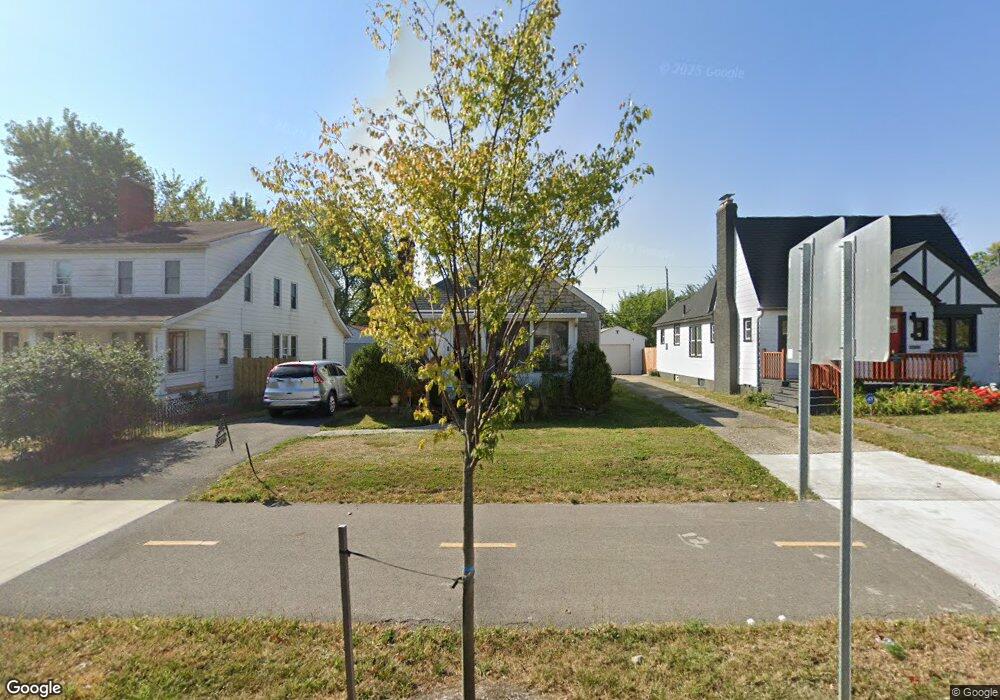
This home is located at 1379 E Hudson St, Columbus, OH 43211 and is currently estimated at $135,225, approximately $144 per square foot. 1379 E Hudson St is a home located in Franklin County with nearby schools including Linden-Mckinley Stem School On Arcadia, North Columbus Preparatory Academy, and Midnimo Cross Cultural Middle School.
Ownership History
Date
Name
Owned For
Owner Type
Purchase Details
Closed on
Jul 30, 2005
Sold by
Richardson Henry A and Richardson Camille
Bought by
Richardson Henry A and Richardson Camille
Current Estimated Value
Home Financials for this Owner
Home Financials are based on the most recent Mortgage that was taken out on this home.
Original Mortgage
$87,000
Outstanding Balance
$44,545
Interest Rate
5.66%
Mortgage Type
Fannie Mae Freddie Mac
Estimated Equity
$90,680
Purchase Details
Closed on
Jun 15, 1994
Sold by
Johns Lawrence H
Bought by
Henry A Richardson
Home Financials for this Owner
Home Financials are based on the most recent Mortgage that was taken out on this home.
Original Mortgage
$36,800
Interest Rate
8.58%
Mortgage Type
FHA
Purchase Details
Closed on
Jun 10, 1992
Purchase Details
Closed on
Jun 6, 1991
Create a Home Valuation Report for This Property
The Home Valuation Report is an in-depth analysis detailing your home's value as well as a comparison with similar homes in the area
Home Values in the Area
Average Home Value in this Area
Purchase History
| Date | Buyer | Sale Price | Title Company |
|---|---|---|---|
| Richardson Henry A | -- | Supreme | |
| Henry A Richardson | $36,500 | -- | |
| -- | $26,900 | -- | |
| -- | $27,000 | -- |
Source: Public Records
Mortgage History
| Date | Status | Borrower | Loan Amount |
|---|---|---|---|
| Open | Richardson Henry A | $87,000 | |
| Closed | Henry A Richardson | $36,800 |
Source: Public Records
Tax History
| Year | Tax Paid | Tax Assessment Tax Assessment Total Assessment is a certain percentage of the fair market value that is determined by local assessors to be the total taxable value of land and additions on the property. | Land | Improvement |
|---|---|---|---|---|
| 2025 | $1,561 | $34,790 | $5,460 | $29,330 |
| 2024 | $1,561 | $34,790 | $5,460 | $29,330 |
| 2023 | $1,541 | $34,790 | $5,460 | $29,330 |
| 2022 | $892 | $17,190 | $2,770 | $14,420 |
| 2021 | $893 | $17,190 | $2,770 | $14,420 |
| 2020 | $894 | $17,190 | $2,770 | $14,420 |
| 2019 | $869 | $14,320 | $2,310 | $12,010 |
| 2018 | $834 | $14,320 | $2,310 | $12,010 |
| 2017 | $875 | $14,320 | $2,310 | $12,010 |
| 2016 | $882 | $13,310 | $3,330 | $9,980 |
| 2015 | $800 | $13,310 | $3,330 | $9,980 |
| 2014 | $802 | $13,310 | $3,330 | $9,980 |
| 2013 | $439 | $14,770 | $3,675 | $11,095 |
Source: Public Records
Map
Nearby Homes
- 1435 Kohr Place
- 1362 Clinton St
- 1430 Kenmore Rd
- 1481 Kohr Place
- 2260 Homestead Dr
- 2225 Medina Ave
- 1509 Loretta Ave
- 2204 Medina Ave
- 2316 Ontario St
- 1457 Cordell Ave
- 1450 Briarwood Ave
- 2157 Cleveland Ave Unit 2153
- 2163 Cleveland Ave Unit 2161
- 2305 Cleveland Ave
- 1544 Briarwood Ave
- 0 E Maynard Ave
- 2126 Cleveland Ave
- 1545 Arlington Ave
- 1411 Genessee Ave
- 1564-1566 E Blake Ave
- 1373 E Hudson St
- 1383 E Hudson St Unit 385
- 1367 E Hudson St
- 1367 E Hudson St Unit L 2
- 1393 E Hudson St
- 1363 E Hudson St
- 2297 Dresden St
- 1384 E Hudson St
- 2293 Dresden St
- 1357 E Hudson St
- 1366 E Tompkins St
- 1378 E Hudson St
- 1360 E Tompkins St
- 1390 E Hudson St
- 1374 E Hudson St
- 2287 Dresden St
- 1356 E Tompkins St
- 1394 E Hudson St
- 1351 E Hudson St
- 1400 E Hudson St
Your Personal Tour Guide
Ask me questions while you tour the home.