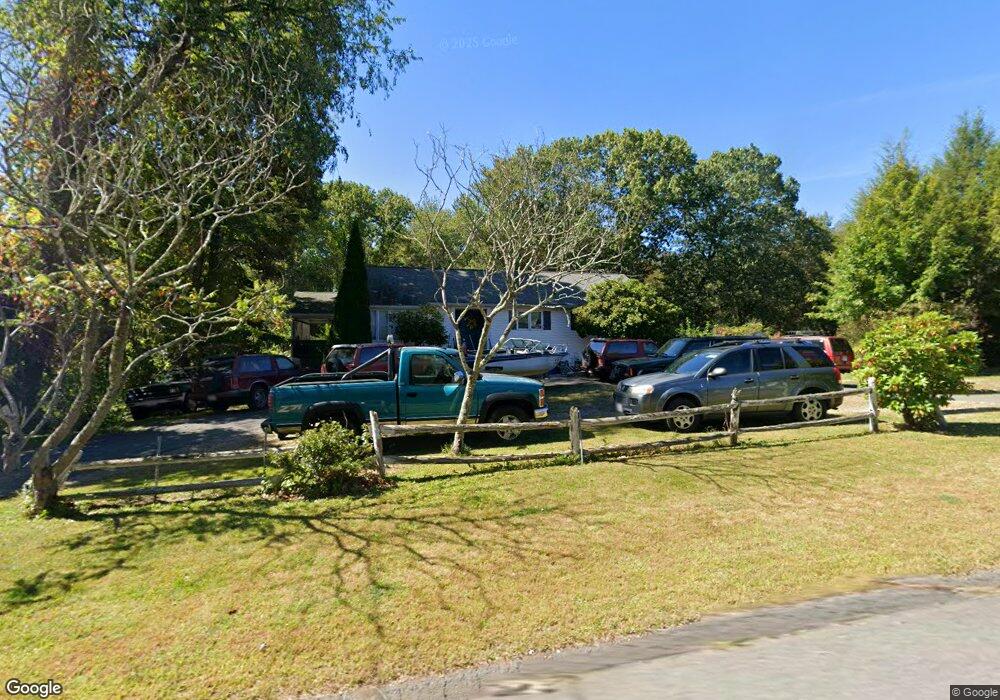
1379 Piper Rd West Springfield, MA 01089
Estimated Value: $382,977 - $421,000
2
Beds
2
Baths
1,300
Sq Ft
$311/Sq Ft
Est. Value
About This Home
This home is located at 1379 Piper Rd, West Springfield, MA 01089 and is currently estimated at $403,994, approximately $310 per square foot. 1379 Piper Rd is a home located in Hampden County with nearby schools including West Springfield High School and St Thomas The Apostle School.
Ownership History
Date
Name
Owned For
Owner Type
Purchase Details
Closed on
Jan 23, 2014
Sold by
Chraplak Daniel E
Bought by
Chraplak Daniel E and Barufaldi Tonya J
Current Estimated Value
Home Financials for this Owner
Home Financials are based on the most recent Mortgage that was taken out on this home.
Original Mortgage
$119,000
Outstanding Balance
$33,586
Interest Rate
4.4%
Estimated Equity
$370,408
Purchase Details
Closed on
Nov 13, 1998
Sold by
Moulton Robert S and Moulton Kathleend
Bought by
Giroux Darnell M and Chraplak Daniel
Home Financials for this Owner
Home Financials are based on the most recent Mortgage that was taken out on this home.
Original Mortgage
$122,700
Interest Rate
6.65%
Mortgage Type
Purchase Money Mortgage
Create a Home Valuation Report for This Property
The Home Valuation Report is an in-depth analysis detailing your home's value as well as a comparison with similar homes in the area
Home Values in the Area
Average Home Value in this Area
Purchase History
| Date | Buyer | Sale Price | Title Company |
|---|---|---|---|
| Chraplak Daniel E | -- | -- | |
| Giroux Darnell M | $132,500 | -- |
Source: Public Records
Mortgage History
| Date | Status | Borrower | Loan Amount |
|---|---|---|---|
| Open | Chraplak Daniel E | $119,000 | |
| Previous Owner | Giroux Darnell M | $122,700 |
Source: Public Records
Tax History
| Year | Tax Paid | Tax Assessment Tax Assessment Total Assessment is a certain percentage of the fair market value that is determined by local assessors to be the total taxable value of land and additions on the property. | Land | Improvement |
|---|---|---|---|---|
| 2025 | $4,855 | $326,500 | $116,200 | $210,300 |
| 2024 | $4,772 | $322,200 | $116,200 | $206,000 |
| 2023 | $4,555 | $293,100 | $116,200 | $176,900 |
| 2022 | $4,113 | $261,000 | $105,700 | $155,300 |
| 2021 | $3,853 | $228,000 | $86,500 | $141,500 |
| 2020 | $3,811 | $224,300 | $86,500 | $137,800 |
| 2019 | $3,804 | $224,300 | $86,500 | $137,800 |
| 2018 | $3,824 | $224,300 | $86,500 | $137,800 |
| 2017 | $3,824 | $224,300 | $86,500 | $137,800 |
| 2016 | $3,777 | $222,300 | $81,400 | $140,900 |
| 2015 | $3,700 | $217,800 | $79,600 | $138,200 |
| 2014 | $865 | $209,700 | $79,600 | $130,100 |
Source: Public Records
Map
Nearby Homes
- 404 Brush Hill Ave
- 11 Annie's Way
- 361 Prospect Ave
- 80 Brush Hill Ave Unit 61
- 791 Morgan Rd
- 10 Beauregard Terrace
- 89-111 Whitney Ave
- 36 Shady Brook
- 0 Ahiska Rd Unit 73477754
- 87 Blanchwood Ave
- 750 Amostown Rd
- 86 Beaumont Ave
- 51 Beaumont Ave
- 34 High Meadow Dr
- 2 Windpath E
- 21 Depot St
- 0 School St
- 76 Joy St
- 27 Abbey St
- 439 Oldfield Rd
Your Personal Tour Guide
Ask me questions while you tour the home.