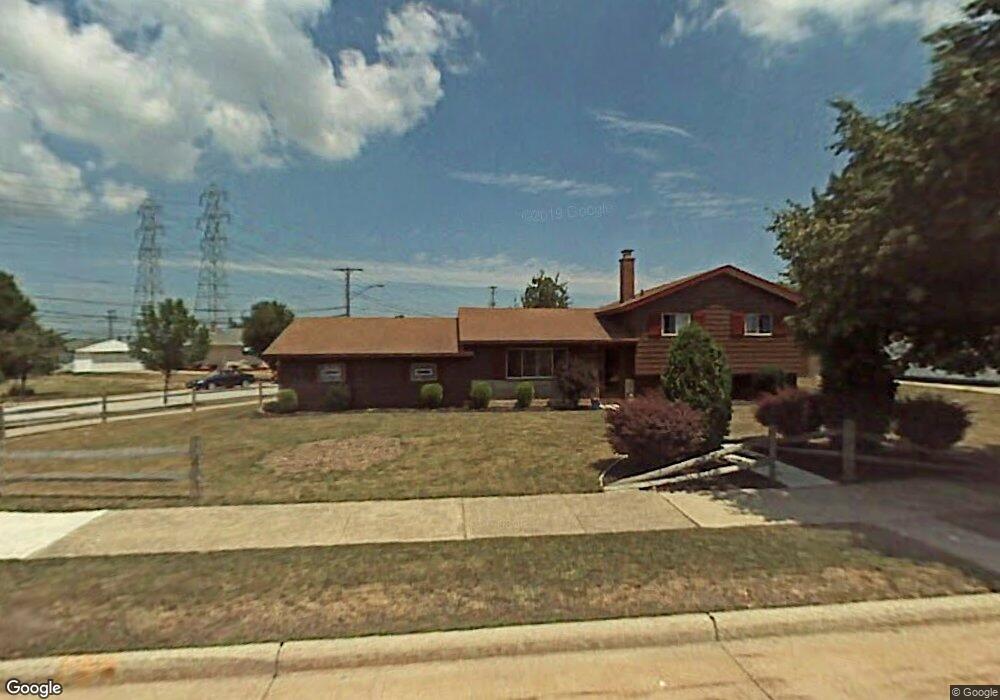
13792 Brookhaven Blvd Brookpark, OH 44142
Estimated Value: $237,000 - $251,000
3
Beds
1
Bath
1,452
Sq Ft
$166/Sq Ft
Est. Value
About This Home
This home is located at 13792 Brookhaven Blvd, Brookpark, OH 44142 and is currently estimated at $241,469, approximately $166 per square foot. 13792 Brookhaven Blvd is a home located in Cuyahoga County with nearby schools including Berea-Midpark Middle School, Berea-Midpark High School, and Huber Heights Preparatory Academy Parma Academy.
Ownership History
Date
Name
Owned For
Owner Type
Purchase Details
Closed on
Oct 7, 2005
Sold by
Lawrence Cathy L and Lawrence Shawn P
Bought by
Smith James D and Smith Loreen M
Current Estimated Value
Home Financials for this Owner
Home Financials are based on the most recent Mortgage that was taken out on this home.
Original Mortgage
$97,500
Outstanding Balance
$52,581
Interest Rate
5.88%
Mortgage Type
Fannie Mae Freddie Mac
Estimated Equity
$188,888
Purchase Details
Closed on
Jul 11, 2001
Sold by
Estate Of John E Prystash
Bought by
Prystash Cathy L
Purchase Details
Closed on
Aug 16, 1979
Sold by
Prystash John E
Bought by
John E Prystash
Purchase Details
Closed on
Oct 31, 1978
Sold by
Cunningham Richard S
Bought by
Prystash John E
Purchase Details
Closed on
Jul 20, 1976
Sold by
Dottore Rose M
Bought by
Cunningham Richard S
Purchase Details
Closed on
Jan 1, 1975
Bought by
Dottore Rose M
Create a Home Valuation Report for This Property
The Home Valuation Report is an in-depth analysis detailing your home's value as well as a comparison with similar homes in the area
Home Values in the Area
Average Home Value in this Area
Purchase History
| Date | Buyer | Sale Price | Title Company |
|---|---|---|---|
| Smith James D | $137,500 | Premier Title Agency Ltd | |
| Prystash Cathy L | -- | -- | |
| John E Prystash | -- | -- | |
| Prystash John E | $54,000 | -- | |
| Cunningham Richard S | $38,500 | -- | |
| Dottore Rose M | -- | -- |
Source: Public Records
Mortgage History
| Date | Status | Borrower | Loan Amount |
|---|---|---|---|
| Open | Smith James D | $97,500 |
Source: Public Records
Tax History Compared to Growth
Tax History
| Year | Tax Paid | Tax Assessment Tax Assessment Total Assessment is a certain percentage of the fair market value that is determined by local assessors to be the total taxable value of land and additions on the property. | Land | Improvement |
|---|---|---|---|---|
| 2024 | $3,425 | $67,900 | $18,165 | $49,735 |
| 2023 | $3,303 | $54,220 | $13,790 | $40,430 |
| 2022 | $3,279 | $54,220 | $13,790 | $40,430 |
| 2021 | $3,260 | $54,220 | $13,790 | $40,430 |
| 2020 | $2,942 | $43,050 | $10,960 | $32,100 |
| 2019 | $2,854 | $123,000 | $31,300 | $91,700 |
| 2018 | $2,842 | $43,050 | $10,960 | $32,100 |
| 2017 | $2,716 | $38,010 | $9,240 | $28,770 |
| 2016 | $2,694 | $38,010 | $9,240 | $28,770 |
| 2015 | $2,407 | $38,010 | $9,240 | $28,770 |
| 2014 | $2,407 | $36,200 | $8,790 | $27,410 |
Source: Public Records
Map
Nearby Homes
- 14344 Fayette Blvd
- 14417 Parkman Blvd
- 13489 Havendale Dr
- 14055 Donald Dr
- 5677 Gateway Ln Unit E504
- 13602 Holland Rd
- 13971 Park Dr
- 6274 Anita Dr
- 6321 W 130th St
- 6330 Michael Dr
- 6333 W 130th St
- 5348 W 147th St
- 13879 Zaremba Dr
- 11914 Tucson Dr
- 15450 Holland Rd
- 6369 Anita Dr
- 5198 W 148th St
- 15665 Holland Rd
- 13765 Newton Rd
- 15800 Holland Rd
- 13768 Brookhaven Blvd
- 13748 Brookhaven Blvd
- 5827 Middlebrook Blvd
- 5834 Middlebrook Blvd
- 13785 Brookhaven Blvd
- 13805 Brookhaven Blvd
- 13726 Brookhaven Blvd
- 5850 Middlebrook Blvd
- 13765 Brookhaven Blvd
- 5815 Middlebrook Blvd
- 13831 Brookhaven Blvd
- 13745 Brookhaven Blvd
- 5818 Middlebrook Blvd
- 5858 Middlebrook Blvd
- 13713 Crestway Dr
- 13706 Brookhaven Blvd
- 13725 Brookhaven Blvd
- 5810 Middlebrook Blvd
- 5866 Middlebrook Blvd
- 5842 Middlebrook Blvd