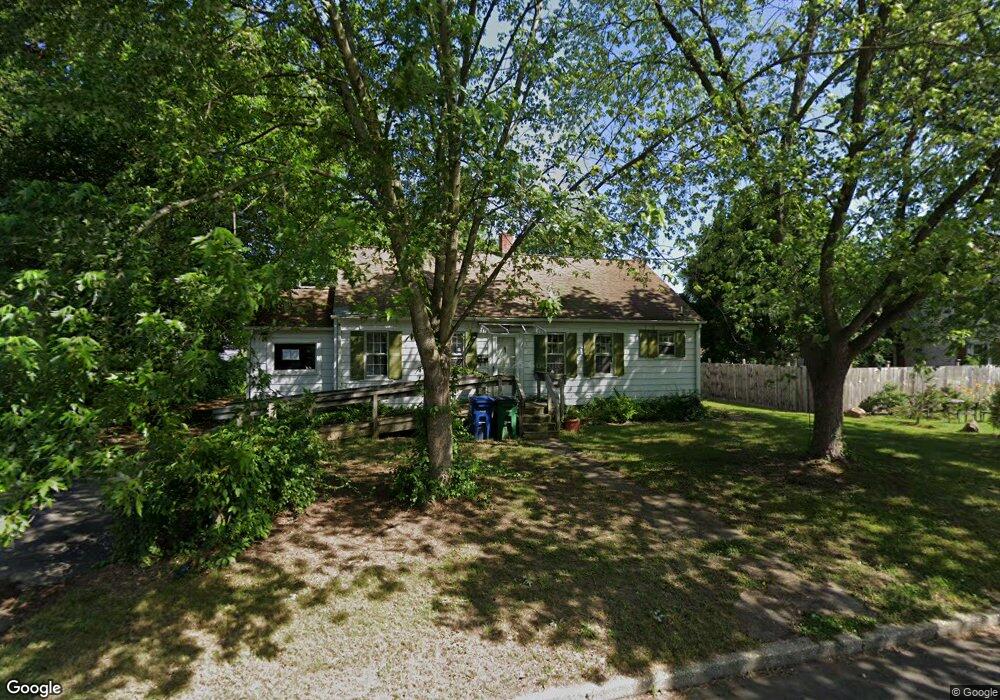
138 Brannan Rd Aberdeen, MD 21001
Estimated Value: $215,000 - $272,000
--
Bed
1
Bath
1,084
Sq Ft
$227/Sq Ft
Est. Value
About This Home
This home is located at 138 Brannan Rd, Aberdeen, MD 21001 and is currently estimated at $246,118, approximately $227 per square foot. 138 Brannan Rd is a home located in Harford County with nearby schools including Halls Cross Roads Elementary School, Aberdeen Middle School, and Aberdeen High School.
Ownership History
Date
Name
Owned For
Owner Type
Purchase Details
Closed on
Aug 14, 2002
Sold by
Smith David A
Bought by
Roop William R and Roop Edna M
Current Estimated Value
Purchase Details
Closed on
Oct 31, 1989
Sold by
Stephens Richard A
Bought by
Smith David A
Home Financials for this Owner
Home Financials are based on the most recent Mortgage that was taken out on this home.
Original Mortgage
$76,760
Interest Rate
9.82%
Create a Home Valuation Report for This Property
The Home Valuation Report is an in-depth analysis detailing your home's value as well as a comparison with similar homes in the area
Home Values in the Area
Average Home Value in this Area
Purchase History
| Date | Buyer | Sale Price | Title Company |
|---|---|---|---|
| Roop William R | $89,900 | -- | |
| Smith David A | $74,900 | -- |
Source: Public Records
Mortgage History
| Date | Status | Borrower | Loan Amount |
|---|---|---|---|
| Previous Owner | Smith David A | $76,760 | |
| Closed | Roop William R | -- |
Source: Public Records
Tax History Compared to Growth
Tax History
| Year | Tax Paid | Tax Assessment Tax Assessment Total Assessment is a certain percentage of the fair market value that is determined by local assessors to be the total taxable value of land and additions on the property. | Land | Improvement |
|---|---|---|---|---|
| 2025 | $1,433 | $159,400 | $0 | $0 |
| 2024 | $1,433 | $150,300 | $0 | $0 |
| 2023 | $1,346 | $141,200 | $46,500 | $94,700 |
| 2022 | $1,330 | $139,500 | $0 | $0 |
| 2021 | $130 | $137,800 | $0 | $0 |
| 2020 | $130 | $136,100 | $46,500 | $89,600 |
| 2019 | $83 | $135,267 | $0 | $0 |
| 2018 | $1,340 | $134,433 | $0 | $0 |
| 2017 | $1,332 | $133,600 | $0 | $0 |
| 2016 | -- | $133,600 | $0 | $0 |
| 2015 | $138 | $133,600 | $0 | $0 |
| 2014 | $138 | $139,100 | $0 | $0 |
Source: Public Records
Map
Nearby Homes