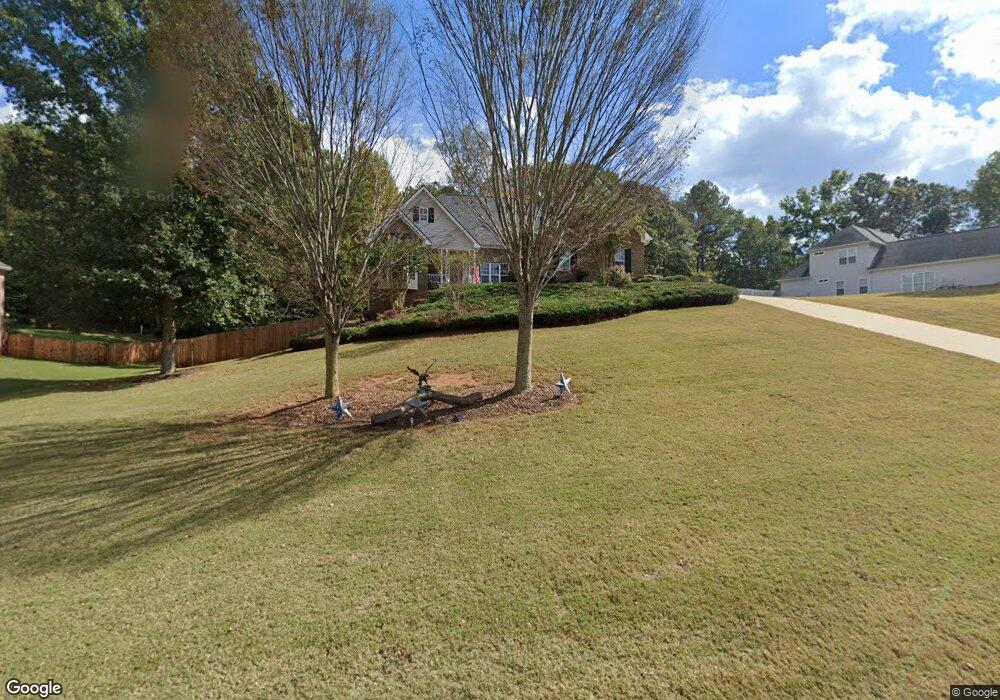
138 Caboose Ct Unit 48 Pendergrass, GA 30567
Estimated Value: $395,512 - $484,000
3
Beds
2
Baths
1,884
Sq Ft
$226/Sq Ft
Est. Value
About This Home
This home is located at 138 Caboose Ct Unit 48, Pendergrass, GA 30567 and is currently estimated at $426,378, approximately $226 per square foot. 138 Caboose Ct Unit 48 is a home located in Jackson County with nearby schools including West Jackson Elementary School, West Jackson Middle School, and Jackson County High School.
Ownership History
Date
Name
Owned For
Owner Type
Purchase Details
Closed on
Jul 23, 2021
Sold by
Green Randall C
Bought by
Bescher Erik and Bescher Myrna
Current Estimated Value
Home Financials for this Owner
Home Financials are based on the most recent Mortgage that was taken out on this home.
Original Mortgage
$358,388
Outstanding Balance
$325,677
Interest Rate
3%
Mortgage Type
FHA
Estimated Equity
$100,701
Purchase Details
Closed on
Dec 23, 2015
Sold by
Mull D Duane
Bought by
Green Randall C
Home Financials for this Owner
Home Financials are based on the most recent Mortgage that was taken out on this home.
Original Mortgage
$176,739
Interest Rate
4.25%
Mortgage Type
FHA
Purchase Details
Closed on
Nov 7, 2007
Sold by
Not Provided
Bought by
Mull Duane D and Mull Kimberly H
Purchase Details
Closed on
Apr 20, 2004
Sold by
Butler Wendell
Bought by
Duane Mull Construction
Create a Home Valuation Report for This Property
The Home Valuation Report is an in-depth analysis detailing your home's value as well as a comparison with similar homes in the area
Home Values in the Area
Average Home Value in this Area
Purchase History
| Date | Buyer | Sale Price | Title Company |
|---|---|---|---|
| Bescher Erik | $365,000 | -- | |
| Green Randall C | $180,000 | -- | |
| Mull Duane D | -- | -- | |
| Duane Mull Construction | $76,000 | -- |
Source: Public Records
Mortgage History
| Date | Status | Borrower | Loan Amount |
|---|---|---|---|
| Open | Bescher Erik | $358,388 | |
| Previous Owner | Green Randall C | $176,739 |
Source: Public Records
Tax History Compared to Growth
Tax History
| Year | Tax Paid | Tax Assessment Tax Assessment Total Assessment is a certain percentage of the fair market value that is determined by local assessors to be the total taxable value of land and additions on the property. | Land | Improvement |
|---|---|---|---|---|
| 2024 | $3,289 | $132,240 | $26,400 | $105,840 |
| 2023 | $3,289 | $120,960 | $26,400 | $94,560 |
| 2022 | $2,829 | $98,960 | $18,480 | $80,480 |
| 2021 | $2,849 | $98,960 | $18,480 | $80,480 |
| 2020 | $2,702 | $85,280 | $18,480 | $66,800 |
| 2019 | $2,743 | $85,280 | $18,480 | $66,800 |
| 2018 | $2,679 | $82,040 | $18,480 | $63,560 |
| 2017 | $2,581 | $78,224 | $18,500 | $59,724 |
| 2016 | $2,396 | $72,832 | $11,200 | $61,632 |
| 2015 | $2,433 | $72,832 | $11,200 | $61,632 |
| 2014 | $2,082 | $61,488 | $11,200 | $50,288 |
| 2013 | -- | $61,488 | $11,200 | $50,288 |
Source: Public Records
Map
Nearby Homes
- 0 Kinney Creek Ln Unit 10609320
- 67 Crab Orchard Way
- 61 Crab Orchard Way
- 626 Walnut Creek Pkwy
- 606 Walnut Creek Pkwy
- 584 Walnut Creek Pkwy
- 562 Walnut Creek Pkwy
- 100 Gleneagles Way
- 532 Walnut Creek Pkwy
- 502 Walnut Creek Pkwy
- 622 Pocket Rd
- 4515 Highway 60
- 0 Guy Cooper Rd Unit 10545221
- 749 Hubert Pittman Tract 2 Rd
- 749 Hubert Pittman Rd Unit TRACT 2
- 749 Hubert Pittman Rd Unit TRACT 2 AND 3
- 749 Hubert Pittman Rd
- 749 Hubert Pittman Rd Unit TRACT 3
- 1745 Liberty Park Dr
- 298 Fox Creek Dr
- 138 Caboose Ct
- 138 Caboose Ct Unit 1
- 172 Caboose Ct
- 116 Caboose Ct
- 0 Caboose Ct Unit 8363847
- 0 Caboose Ct Unit 8757081
- 0 Caboose Ct Unit 8851494
- 0 Caboose Ct Unit 7439654
- 194 Caboose Ct
- 127 Caboose Ct
- 167 Caboose Ct
- 70 Caboose Ct
- 189 Caboose Ct
- 189 Caboose Ct Unit 40
- 101 Caboose Ct
- 85 Iron Horse Cir
- 57 Iron Horse Cir
- 103 Iron Horse Cir
- 218 Caboose Ct
- 77 Caboose Ct