Estimated Value: $492,212 - $514,000
2
Beds
2
Baths
3,360
Sq Ft
$150/Sq Ft
Est. Value
About This Home
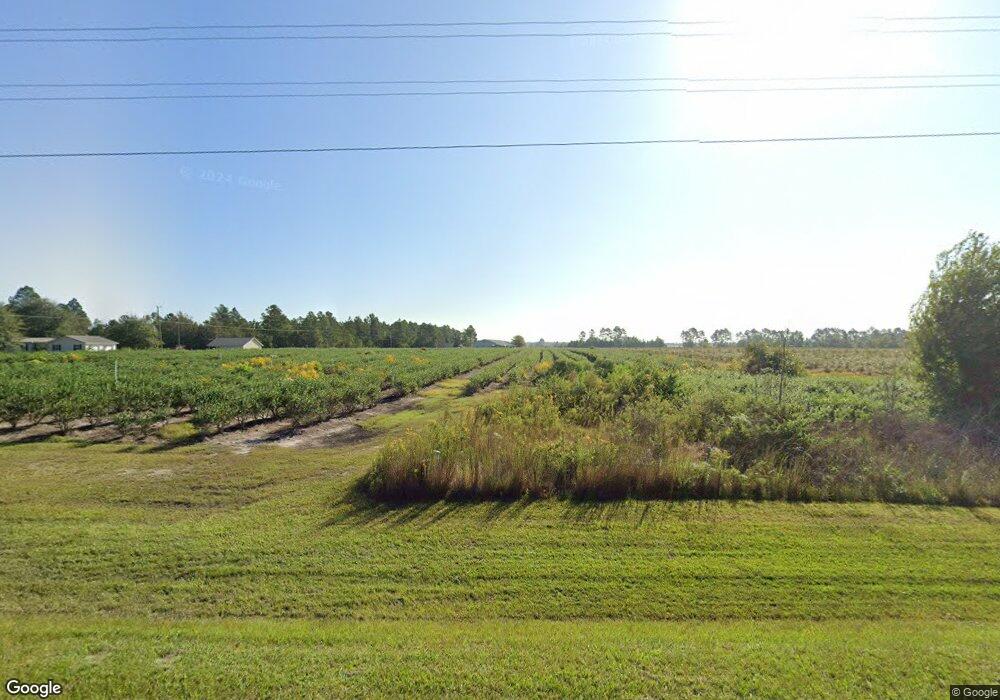
This home is located at 138 Caleb Ln, Alma, GA 31510 and is currently estimated at $503,106, approximately $149 per square foot. 138 Caleb Ln is a home located in Bacon County with nearby schools including Bacon County Primary School, Bacon County Elementary School, and Bacon County Middle School.
Ownership History
Date
Name
Owned For
Owner Type
Purchase Details
Closed on
Sep 28, 2017
Sold by
Jjs Blueberry Farm Llc
Bought by
Hancock Raymond and Hancock Sonja K
Current Estimated Value
Home Financials for this Owner
Home Financials are based on the most recent Mortgage that was taken out on this home.
Original Mortgage
$250,000
Outstanding Balance
$172,989
Interest Rate
3.82%
Mortgage Type
New Conventional
Estimated Equity
$330,117
Purchase Details
Closed on
Sep 6, 2013
Sold by
Federal National Mortgage Association
Bought by
Jjs Blueberry Farm Llc
Purchase Details
Closed on
Apr 15, 2013
Sold by
Green Tree Servicing Llc
Bought by
Federal National Mortgage Association
Purchase Details
Closed on
Feb 5, 2013
Sold by
Green Tree Servicing Llc
Bought by
Federal National Mtg Associati
Purchase Details
Closed on
May 24, 2004
Sold by
J Floyd Ramsey Trust
Bought by
Mills James P
Create a Home Valuation Report for This Property
The Home Valuation Report is an in-depth analysis detailing your home's value as well as a comparison with similar homes in the area
Home Values in the Area
Average Home Value in this Area
Purchase History
| Date | Buyer | Sale Price | Title Company |
|---|---|---|---|
| Hancock Raymond | $250,000 | -- | |
| Jjs Blueberry Farm Llc | -- | -- | |
| Federal National Mortgage Association | -- | -- | |
| Federal National Mtg Associati | $119,361 | -- | |
| Grenn Tree Servicing Llc | $119,361 | -- | |
| Mills James P | $30,000 | -- |
Source: Public Records
Mortgage History
| Date | Status | Borrower | Loan Amount |
|---|---|---|---|
| Open | Hancock Raymond | $250,000 |
Source: Public Records
Tax History Compared to Growth
Tax History
| Year | Tax Paid | Tax Assessment Tax Assessment Total Assessment is a certain percentage of the fair market value that is determined by local assessors to be the total taxable value of land and additions on the property. | Land | Improvement |
|---|---|---|---|---|
| 2024 | $807 | $44,800 | $16,040 | $28,760 |
| 2023 | $841 | $43,840 | $15,080 | $28,760 |
| 2022 | $839 | $43,840 | $15,080 | $28,760 |
| 2021 | $778 | $41,640 | $15,080 | $26,560 |
| 2020 | $1,057 | $47,616 | $12,586 | $35,030 |
| 2019 | $1,057 | $47,616 | $12,586 | $35,030 |
| 2018 | $1,058 | $47,616 | $12,586 | $35,030 |
| 2017 | $1,368 | $47,616 | $12,586 | $35,030 |
| 2016 | $1,056 | $47,616 | $12,586 | $35,030 |
| 2015 | $1,122 | $50,033 | $12,586 | $37,448 |
| 2014 | $1,152 | $50,033 | $12,586 | $37,448 |
| 2013 | $1,152 | $48,823 | $9,600 | $39,223 |
Source: Public Records
Map
Nearby Homes
- 2148 Georgia 32
- 596 Teakwood Rd
- 9.22 Rhine Rd
- 1608 W 4th St
- 600 Teakwood Rd
- 598 Teakwood Rd
- 174 Perch Rd
- 1505 W 4th Street Extension
- 824 Old Dixie School Rd
- 220 Lakeshore Dr
- 220 Lake Shore Dr
- 0 W 4th Street Extension Unit 10650393
- 0 Lake Lure Dr
- 1109 W 4th Street Extension
- W 4th St
- 224 Meadow Rd
- 118 Morris Dr
- 166 Grace Loop Unit 1
- 0 Stewart Cemetery Rd Unit 10650398
- 198 Meadow Rd
- 284 Old Dixie School Rd
- 311 Old Dixie School Rd
- 206 Old Dixie School Rd
- 00 Moray Rd Approx 106 Ac
- 299 Quart Douglas Rd
- 307 Moray Rd
- 00 Moray Rd
- 174 Old Dixie School Rd
- 161 Spree Rd
- 311 Moray Rd
- 235 Moray Rd
- 167 Copper Lake Rd
- 225 Moray Rd
- 140 Woodruff Ln
- 315 Moray Rd
- 193 Moray Rd
- 174 Copper Lake Rd
- 209 Old Dixie School Rd (Test Listing)
- 245 Moray Rd
- 313 Moray Rd