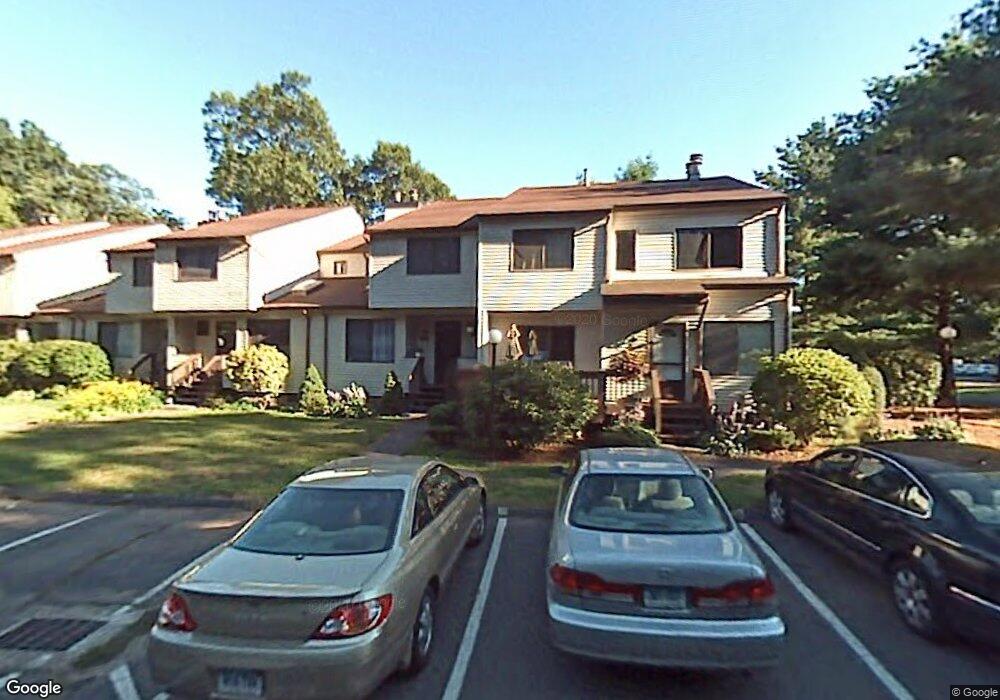
138 Cypress Rd Newington, CT 06111
Estimated Value: $259,884 - $276,000
2
Beds
2
Baths
1,205
Sq Ft
$221/Sq Ft
Est. Value
About This Home
This home is located at 138 Cypress Rd, Newington, CT 06111 and is currently estimated at $265,721, approximately $220 per square foot. 138 Cypress Rd is a home located in Hartford County with nearby schools including Ruth Chaffee School, John Wallace Middle School, and Newington High School.
Ownership History
Date
Name
Owned For
Owner Type
Purchase Details
Closed on
Jan 31, 2011
Sold by
Us Bank Na
Bought by
Heda Vijay
Current Estimated Value
Home Financials for this Owner
Home Financials are based on the most recent Mortgage that was taken out on this home.
Original Mortgage
$118,000
Outstanding Balance
$80,641
Interest Rate
4.83%
Estimated Equity
$185,080
Purchase Details
Closed on
May 11, 2005
Sold by
Milbrandt Geoffrey H
Bought by
Rodriguez Patricia
Home Financials for this Owner
Home Financials are based on the most recent Mortgage that was taken out on this home.
Original Mortgage
$140,720
Interest Rate
7.1%
Purchase Details
Closed on
Jul 26, 2002
Sold by
Strong James F and Strong Theresa F
Bought by
Milbrandt Geoffrey H
Home Financials for this Owner
Home Financials are based on the most recent Mortgage that was taken out on this home.
Original Mortgage
$129,600
Interest Rate
6.73%
Purchase Details
Closed on
Oct 22, 1996
Sold by
Gat Dimitri
Bought by
Strong James F and Frazier Theresa A
Create a Home Valuation Report for This Property
The Home Valuation Report is an in-depth analysis detailing your home's value as well as a comparison with similar homes in the area
Home Values in the Area
Average Home Value in this Area
Purchase History
| Date | Buyer | Sale Price | Title Company |
|---|---|---|---|
| Heda Vijay | $132,000 | -- | |
| Rodriguez Patricia | $175,900 | -- | |
| Milbrandt Geoffrey H | $136,500 | -- | |
| Strong James F | $82,000 | -- |
Source: Public Records
Mortgage History
| Date | Status | Borrower | Loan Amount |
|---|---|---|---|
| Open | Strong James F | $118,000 | |
| Previous Owner | Strong James F | $140,720 | |
| Previous Owner | Strong James F | $35,180 | |
| Previous Owner | Strong James F | $129,600 |
Source: Public Records
Tax History Compared to Growth
Tax History
| Year | Tax Paid | Tax Assessment Tax Assessment Total Assessment is a certain percentage of the fair market value that is determined by local assessors to be the total taxable value of land and additions on the property. | Land | Improvement |
|---|---|---|---|---|
| 2025 | $4,150 | $103,810 | $0 | $103,810 |
| 2024 | $4,118 | $103,810 | $0 | $103,810 |
| 2023 | $3,982 | $103,810 | $0 | $103,810 |
| 2022 | $3,996 | $103,810 | $0 | $103,810 |
| 2021 | $4,029 | $103,810 | $0 | $103,810 |
| 2020 | $4,129 | $105,110 | $0 | $105,110 |
| 2019 | $4,147 | $105,110 | $0 | $105,110 |
| 2018 | $4,047 | $105,110 | $0 | $105,110 |
| 2017 | $3,846 | $105,110 | $0 | $105,110 |
| 2016 | $3,758 | $105,110 | $0 | $105,110 |
| 2014 | $3,711 | $106,720 | $0 | $106,720 |
Source: Public Records
Map
Nearby Homes
- 265 Back Ln
- 122 Cottonwood Rd Unit 122
- 159 Cottonwood Rd Unit 159
- 61 Luca Ln
- 76 Luca Lane Homesite 8
- 155 Cottonwood Rd
- 67 Luca (Homesite 6) Ln
- 53 Luca (Homesite 4) Ln
- 8 Stella Dr
- 6 Vinnie Dr
- 231 Cottonwood Rd Unit 231
- 215 Cottonwood Rd
- 39 Pepper Bush Ln
- 98 Crown Ridge
- 263 Two Rod Hwy
- 35 Woodsedge Dr Unit 4C
- 31 Woodsedge Dr Unit 1C
- 5 Robeth Ln
- 111 Brockett St
- 137 Superior Ave
- 128 Cypress Rd
- 128 Cypress Rd Unit 128
- 138 Cypress Rd Unit 138
- 126 Cypress Rd
- 136 Cypress Rd
- 136 Cypress Rd Unit 136
- 130 Cypress Rd
- 140 Cypress Rd
- 140 Cypress Rd Unit 140
- 124 Cypress Rd
- 124 Cypress Rd Unit 124
- 134 Cypress Rd
- 134 Cypress Rd Unit 43
- 134 Cypress Rd Unit 134
- 122 Cypress Rd
- 122 Cypress Rd Unit 122
- 132 Cypress Rd
- 132 Cypress Rd Unit 132
- 90 Cypress Rd
- 100 Cypress Rd