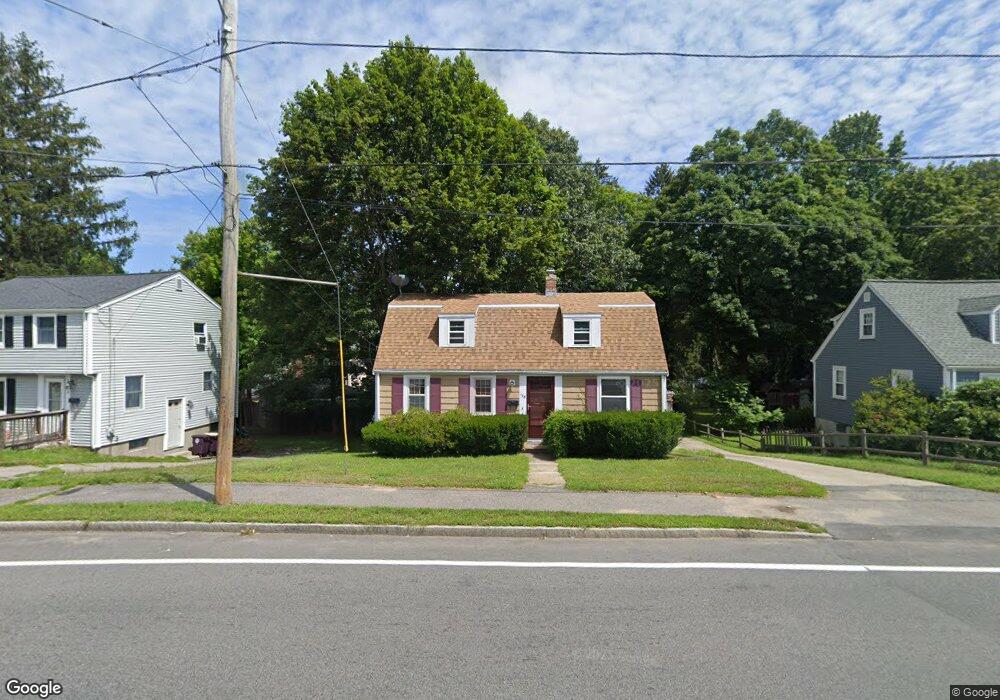
138 Front St Weymouth, MA 02188
Weymouth Landing NeighborhoodEstimated Value: $535,541 - $599,000
3
Beds
1
Bath
1,120
Sq Ft
$505/Sq Ft
Est. Value
About This Home
This home is located at 138 Front St, Weymouth, MA 02188 and is currently estimated at $566,135, approximately $505 per square foot. 138 Front St is a home located in Norfolk County with nearby schools including Frederick C Murphy, Abigail Adams Middle School, and Weymouth Middle School Chapman.
Ownership History
Date
Name
Owned For
Owner Type
Purchase Details
Closed on
Sep 15, 2003
Sold by
Whitehouse Denise M
Bought by
Scott Lawrence R and Mainieri Kathleen
Current Estimated Value
Home Financials for this Owner
Home Financials are based on the most recent Mortgage that was taken out on this home.
Original Mortgage
$232,000
Outstanding Balance
$107,477
Interest Rate
6.22%
Mortgage Type
Purchase Money Mortgage
Estimated Equity
$458,658
Create a Home Valuation Report for This Property
The Home Valuation Report is an in-depth analysis detailing your home's value as well as a comparison with similar homes in the area
Home Values in the Area
Average Home Value in this Area
Purchase History
| Date | Buyer | Sale Price | Title Company |
|---|---|---|---|
| Scott Lawrence R | $290,000 | -- |
Source: Public Records
Mortgage History
| Date | Status | Borrower | Loan Amount |
|---|---|---|---|
| Open | Scott Lawrence R | $232,000 |
Source: Public Records
Tax History
| Year | Tax Paid | Tax Assessment Tax Assessment Total Assessment is a certain percentage of the fair market value that is determined by local assessors to be the total taxable value of land and additions on the property. | Land | Improvement |
|---|---|---|---|---|
| 2025 | $4,307 | $426,400 | $198,200 | $228,200 |
| 2024 | $4,258 | $414,600 | $188,800 | $225,800 |
| 2023 | $3,905 | $373,700 | $174,800 | $198,900 |
| 2022 | $3,860 | $336,800 | $161,900 | $174,900 |
| 2021 | $3,922 | $334,100 | $161,900 | $172,200 |
| 2020 | $3,814 | $320,000 | $161,900 | $158,100 |
| 2019 | $3,781 | $312,000 | $155,700 | $156,300 |
| 2018 | $3,664 | $293,100 | $148,200 | $144,900 |
| 2017 | $3,679 | $287,200 | $141,200 | $146,000 |
| 2016 | $3,543 | $276,800 | $135,800 | $141,000 |
| 2015 | $3,407 | $264,100 | $135,800 | $128,300 |
| 2014 | $3,286 | $247,100 | $126,400 | $120,700 |
Source: Public Records
Map
Nearby Homes
- 15 Summer St
- 122 Washington St Unit Twenty-two
- 25 Richmond St
- 33 Congress St
- 19 Vine St Unit 2
- 37 Lantern Ln
- 41 Lantern Ln
- 46 Roosevelt Rd
- 82 Lester Ln
- 54 Edgemont Rd
- 300 Commercial St Unit 23
- 211 Roosevelt Rd
- 31 Doris Rd
- 26 Tingley Rd
- 312 Shaw St
- 116 Greenvale Ave
- 49 Cornish St
- 70 Biscayne Ave
- 36 Chestnut Ave
- 255 River St
Your Personal Tour Guide
Ask me questions while you tour the home.