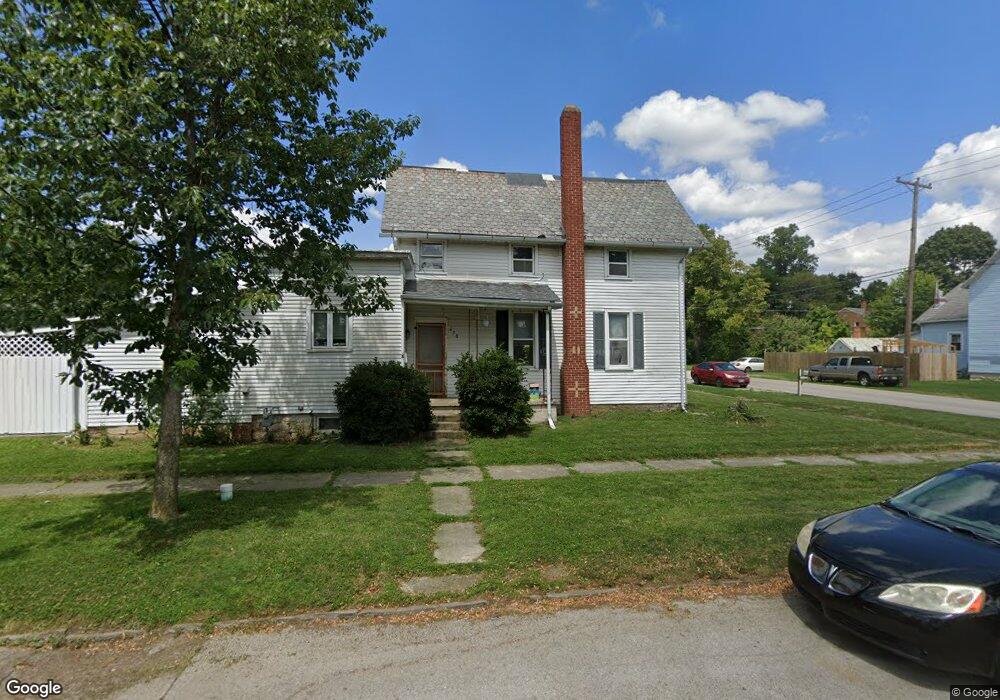
138 Hall St Tiffin, OH 44883
Estimated Value: $100,129 - $150,000
2
Beds
1
Bath
1,116
Sq Ft
$108/Sq Ft
Est. Value
About This Home
This home is located at 138 Hall St, Tiffin, OH 44883 and is currently estimated at $121,032, approximately $108 per square foot. 138 Hall St is a home located in Seneca County with nearby schools including Columbian High School, Calvert Catholic Elementary School, and Calvert High School.
Ownership History
Date
Name
Owned For
Owner Type
Purchase Details
Closed on
Aug 13, 2009
Sold by
Dicken Jody L and Dicken Gary L
Bought by
Hook Preston L and Hook Chelsey L
Current Estimated Value
Home Financials for this Owner
Home Financials are based on the most recent Mortgage that was taken out on this home.
Original Mortgage
$71,400
Outstanding Balance
$45,787
Interest Rate
5.21%
Mortgage Type
FHA
Estimated Equity
$75,245
Purchase Details
Closed on
Jun 30, 2000
Sold by
Nusbaum Robert M
Bought by
Eastlick Jody L
Create a Home Valuation Report for This Property
The Home Valuation Report is an in-depth analysis detailing your home's value as well as a comparison with similar homes in the area
Home Values in the Area
Average Home Value in this Area
Purchase History
| Date | Buyer | Sale Price | Title Company |
|---|---|---|---|
| Hook Preston L | $70,000 | Assured Title | |
| Eastlick Jody L | $62,500 | -- |
Source: Public Records
Mortgage History
| Date | Status | Borrower | Loan Amount |
|---|---|---|---|
| Open | Hook Preston L | $71,400 |
Source: Public Records
Tax History
| Year | Tax Paid | Tax Assessment Tax Assessment Total Assessment is a certain percentage of the fair market value that is determined by local assessors to be the total taxable value of land and additions on the property. | Land | Improvement |
|---|---|---|---|---|
| 2025 | $2,096 | $26,000 | $3,150 | $22,850 |
| 2024 | $1,925 | $26,000 | $3,150 | $22,850 |
| 2023 | $1,803 | $26,000 | $3,150 | $22,850 |
| 2022 | $1,628 | $20,030 | $2,530 | $17,500 |
| 2021 | $1,686 | $20,030 | $2,530 | $17,500 |
| 2020 | $1,568 | $20,031 | $2,527 | $17,504 |
| 2019 | $1,568 | $19,422 | $2,520 | $16,902 |
| 2018 | $1,543 | $19,422 | $2,520 | $16,902 |
| 2017 | $1,600 | $19,422 | $2,520 | $16,902 |
| 2016 | $1,394 | $18,211 | $2,471 | $15,740 |
| 2015 | $1,442 | $18,211 | $2,471 | $15,740 |
| 2014 | $1,348 | $18,211 | $2,471 | $15,740 |
| 2013 | $1,399 | $18,578 | $2,520 | $16,058 |
Source: Public Records
Map
Nearby Homes
- 245 Franklin St
- 48 Clay St
- 212 Benner St
- 376 Water St
- 225 4th Ave
- 239 4th Ave
- 117 E Perry St
- 2695 Ohio 18
- 0 Miami St Unit 10003054
- 0 Miami St Unit Parcel 2
- 0 Miami St Unit 20260131
- 112 Liberty St
- 192 E Perry St
- 311 W Perry St
- 0 Township Road 198a Unit Parcel 4
- 0 Township Road 198a Unit 10003057
- 0 W Tr 198a Unit 20260135
- 314 S Sandusky St
- 376 W Perry St
- 22 Tiffin St
Your Personal Tour Guide
Ask me questions while you tour the home.