Estimated Value: $504,000 - $571,000
4
Beds
3
Baths
2,520
Sq Ft
$210/Sq Ft
Est. Value
About This Home
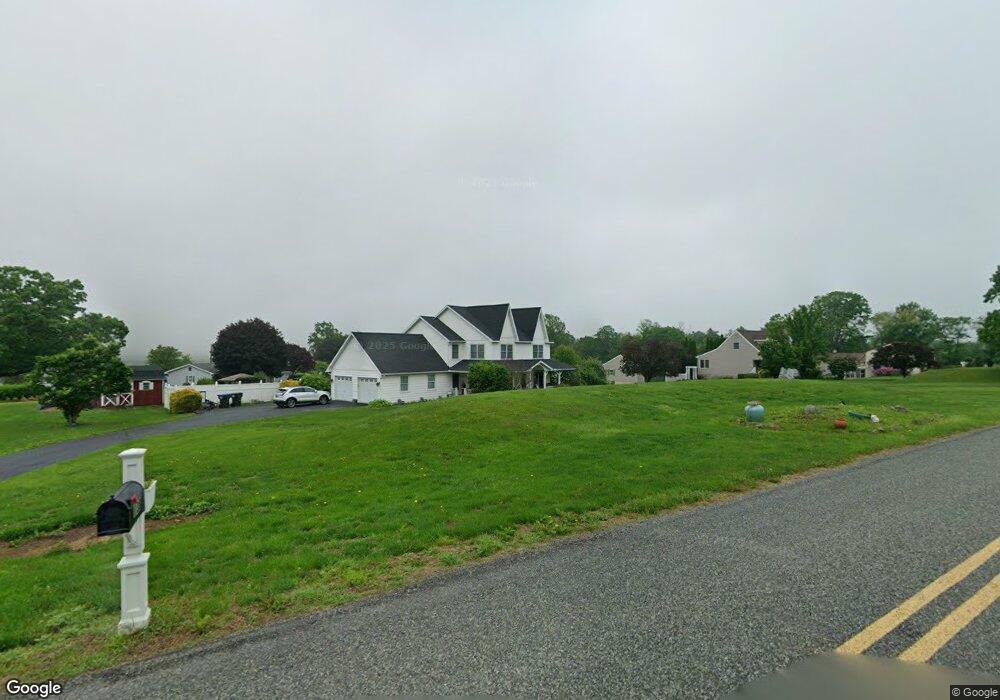
This home is located at 138 Henry Rd, Barto, PA 19504 and is currently estimated at $529,388, approximately $210 per square foot. 138 Henry Rd is a home located in Montgomery County with nearby schools including Boyertown Area Senior High School, Saint Francis Classical Catholic Academy, and St. Francis Academy.
Ownership History
Date
Name
Owned For
Owner Type
Purchase Details
Closed on
Apr 21, 2021
Sold by
Fanelli Denise M
Bought by
Fanelli Denise M and Fanelli David J
Current Estimated Value
Purchase Details
Closed on
May 10, 2007
Sold by
Dimascio Christopher and Dimascio Denise M
Bought by
Dimascio Denise M
Home Financials for this Owner
Home Financials are based on the most recent Mortgage that was taken out on this home.
Original Mortgage
$190,000
Outstanding Balance
$116,201
Interest Rate
6.27%
Estimated Equity
$413,187
Purchase Details
Closed on
Nov 23, 2001
Sold by
Dimascio Christopher and Dimascio Denise M
Bought by
Dimascio Christopher and Dimascio Denise M
Purchase Details
Closed on
Sep 27, 1999
Sold by
Endy Joan D and Graber Daniel A
Bought by
Dimascio Christopher and Eppler Denise M
Create a Home Valuation Report for This Property
The Home Valuation Report is an in-depth analysis detailing your home's value as well as a comparison with similar homes in the area
Home Values in the Area
Average Home Value in this Area
Purchase History
| Date | Buyer | Sale Price | Title Company |
|---|---|---|---|
| Fanelli Denise M | -- | None Available | |
| Dimascio Denise M | -- | None Available | |
| Dimascio Christopher | -- | -- | |
| Dimascio Christopher | $40,500 | -- |
Source: Public Records
Mortgage History
| Date | Status | Borrower | Loan Amount |
|---|---|---|---|
| Open | Dimascio Denise M | $190,000 |
Source: Public Records
Tax History Compared to Growth
Tax History
| Year | Tax Paid | Tax Assessment Tax Assessment Total Assessment is a certain percentage of the fair market value that is determined by local assessors to be the total taxable value of land and additions on the property. | Land | Improvement |
|---|---|---|---|---|
| 2025 | $7,153 | $181,130 | $36,860 | $144,270 |
| 2024 | $7,153 | $181,130 | $36,860 | $144,270 |
| 2023 | $6,800 | $181,130 | $36,860 | $144,270 |
| 2022 | $6,586 | $181,130 | $36,860 | $144,270 |
| 2021 | $6,380 | $181,130 | $36,860 | $144,270 |
| 2020 | $6,064 | $181,130 | $36,860 | $144,270 |
| 2019 | $5,890 | $181,130 | $36,860 | $144,270 |
| 2018 | $1,024 | $181,130 | $36,860 | $144,270 |
| 2017 | $5,419 | $181,130 | $36,860 | $144,270 |
| 2016 | $5,349 | $181,130 | $36,860 | $144,270 |
| 2015 | $5,094 | $181,130 | $36,860 | $144,270 |
| 2014 | $5,094 | $181,130 | $36,860 | $144,270 |
Source: Public Records
Map
Nearby Homes
- 154 Niantic Rd
- 483 Gehman Rd
- 25 Berks Mont Ln
- 21 Berks Mont Ln
- 38 Laura Dr
- 48 Christi Dr
- 55 Laura Dr
- 172 Stone Rd
- 107, D2 Dogwood St
- 315 Dogwood St
- 127 Pheasant Cir
- 2390 Old Route 100
- 2100 Fox Hollow Ln
- 840 Lee Rd
- 11 Bishop Pine Rd
- 7 Mockingbird Ct
- 70 Sugar Maple Rd
- 125 Stauffer Rd
- 127 Stauffer Rd
- 129 Stauffer Rd