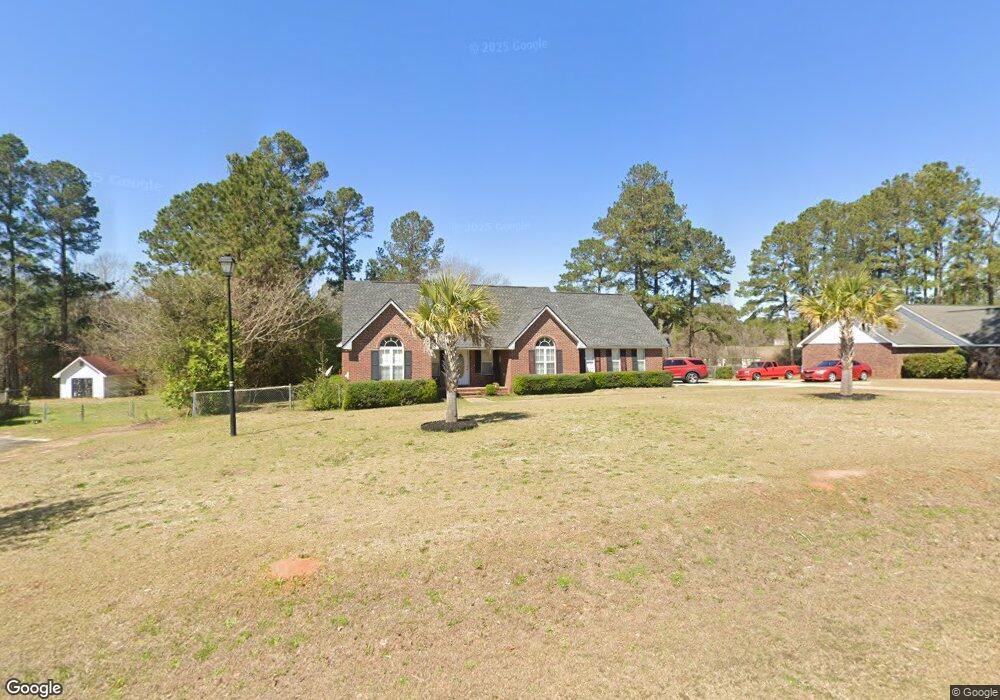
138 Longview Dr Orangeburg, SC 29118
Estimated Value: $248,000 - $297,000
3
Beds
2
Baths
1,642
Sq Ft
$165/Sq Ft
Est. Value
About This Home
This home is located at 138 Longview Dr, Orangeburg, SC 29118 and is currently estimated at $271,671, approximately $165 per square foot. 138 Longview Dr is a home located in Orangeburg County with nearby schools including Marshall Elementary School, Marshall Elementary, and William J. Clark Middle School.
Ownership History
Date
Name
Owned For
Owner Type
Purchase Details
Closed on
Apr 19, 2018
Sold by
Castro Margie A and Castro George E
Bought by
Clark James and Clark Ashley
Current Estimated Value
Home Financials for this Owner
Home Financials are based on the most recent Mortgage that was taken out on this home.
Original Mortgage
$172,713
Outstanding Balance
$151,591
Interest Rate
5.37%
Mortgage Type
FHA
Estimated Equity
$120,080
Purchase Details
Closed on
Jun 13, 2006
Sold by
Wachovia Bank Na
Bought by
Castro Margie A and Castro George E
Home Financials for this Owner
Home Financials are based on the most recent Mortgage that was taken out on this home.
Original Mortgage
$117,900
Interest Rate
6.6%
Mortgage Type
New Conventional
Purchase Details
Closed on
Sep 21, 2005
Sold by
Glover Tressa
Bought by
Wachovia Bank Na and Long Beach Mortgage Loan Trust 2002-2
Purchase Details
Closed on
Mar 13, 2002
Sold by
Sing Shri
Bought by
Glover Tressa
Create a Home Valuation Report for This Property
The Home Valuation Report is an in-depth analysis detailing your home's value as well as a comparison with similar homes in the area
Home Values in the Area
Average Home Value in this Area
Purchase History
| Date | Buyer | Sale Price | Title Company |
|---|---|---|---|
| Clark James | $175,900 | None Available | |
| Castro Margie A | $131,000 | None Available | |
| Wachovia Bank Na | $150,000 | -- | |
| Glover Tressa | $165,000 | -- |
Source: Public Records
Mortgage History
| Date | Status | Borrower | Loan Amount |
|---|---|---|---|
| Open | Clark James | $172,713 | |
| Previous Owner | Castro Margie A | $117,900 |
Source: Public Records
Tax History Compared to Growth
Tax History
| Year | Tax Paid | Tax Assessment Tax Assessment Total Assessment is a certain percentage of the fair market value that is determined by local assessors to be the total taxable value of land and additions on the property. | Land | Improvement |
|---|---|---|---|---|
| 2024 | $1,519 | $8,693 | $757 | $7,936 |
| 2023 | $1,231 | $6,657 | $717 | $5,940 |
| 2022 | $1,211 | $6,657 | $717 | $5,940 |
| 2021 | $1,197 | $6,657 | $717 | $5,940 |
| 2020 | $1,171 | $6,657 | $717 | $5,940 |
| 2019 | $1,177 | $6,657 | $717 | $5,940 |
| 2018 | $1,113 | $10,009 | $0 | $0 |
| 2017 | $3,835 | $10,009 | $0 | $0 |
| 2016 | $3,834 | $10,009 | $0 | $0 |
| 2015 | $3,694 | $10,009 | $0 | $0 |
| 2014 | $3,694 | $10,010 | $1,076 | $8,934 |
| 2013 | -- | $6,581 | $717 | $5,864 |
Source: Public Records
Map
Nearby Homes
- 104 Knollwood Ct
- 4265 Columbia Rd
- 408 Grasshopper Ct
- 4057 Creekmoor Dr
- 4098 Slaughter Dr
- 2042 Clifton Cir
- 113 Ginger Unit Subdivision
- 4405 Cricket Dr
- 1501 Harris Dr
- 4480 Deerfield Dr
- 1039 Berkeley Dr
- 1357 Macon Dr
- 0 Ramsgate Dr Unit 24022640
- 4414 Ramsgate Dr
- 1332 Dogwood Dr
- 0 Columbia Rd Unit 24022676
- 1286 Dogwood Dr
- 3236 Hart St
- 3265 Hunter Dr
- 3210 Hunter Dr
- 144 Longview Dr
- 130 Longview Dr
- 123 Knollwood Ct
- 105 Knollwood Ct
- 152 Longview Dr
- 122 Longview Dr
- 112 Knollwood Ct
- 112 Knollwood Ct
- 1790 Mcqueen Blvd
- 123 Longview Dr
- 1824 Mcqueen Blvd
- 113 Knollwood Ct
- 147 Eunice Ln
- 147 Flossie Ln
- 143 Flossie Ln
- 137 Flossie Ln
- 1778 Mcqueen Blvd
- 121 Knollwood Ct
- 1898 Mcqueen Blvd
- 133 Flossie Ln