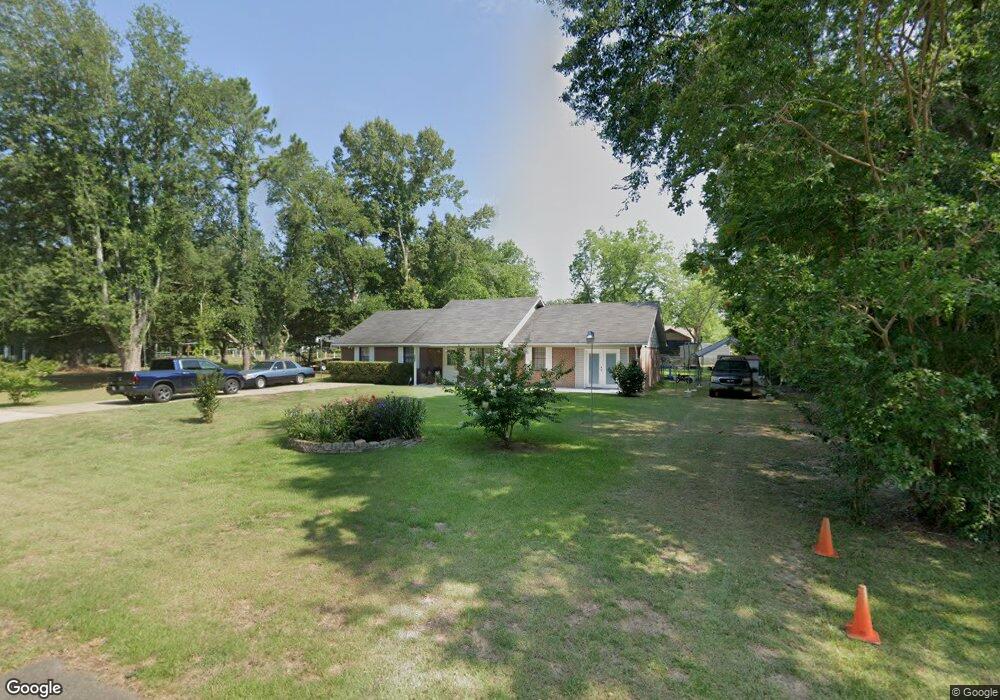
138 Mockingbird Dr Albany, GA 31705
Estimated Value: $146,000 - $168,000
3
Beds
2
Baths
1,691
Sq Ft
$92/Sq Ft
Est. Value
About This Home
This home is located at 138 Mockingbird Dr, Albany, GA 31705 and is currently estimated at $155,797, approximately $92 per square foot. 138 Mockingbird Dr is a home located in Dougherty County with nearby schools including Radium Springs Elementary School, Radium Springs Middle School, and Southside Middle School.
Ownership History
Date
Name
Owned For
Owner Type
Purchase Details
Closed on
Sep 9, 2024
Sold by
Celin Claude
Bought by
Celin Christopher Johnathan
Current Estimated Value
Purchase Details
Closed on
Dec 2, 2020
Sold by
Carter Kristi Ann
Bought by
Celin Claude
Home Financials for this Owner
Home Financials are based on the most recent Mortgage that was taken out on this home.
Original Mortgage
$88,369
Interest Rate
2.7%
Mortgage Type
FHA
Purchase Details
Closed on
Apr 26, 1996
Sold by
Richter Gregory J
Bought by
Richter Kristi Ann
Purchase Details
Closed on
May 26, 1995
Sold by
State Street Bk & Trust Co Tr For Goldom
Bought by
Richter Gregory J
Purchase Details
Closed on
Feb 7, 1995
Sold by
Hobbs Jimmy D & Thelma J By Atty/Fact
Bought by
State Street Bk & Tr Co Tr For Goldome C
Purchase Details
Closed on
Mar 14, 1989
Sold by
Watkins Lumber & Hom
Bought by
Hobbs Jimmy and Hobbs Helma
Create a Home Valuation Report for This Property
The Home Valuation Report is an in-depth analysis detailing your home's value as well as a comparison with similar homes in the area
Home Values in the Area
Average Home Value in this Area
Purchase History
| Date | Buyer | Sale Price | Title Company |
|---|---|---|---|
| Celin Christopher Johnathan | -- | -- | |
| Celin Claude | $90,000 | -- | |
| Richter Kristi Ann | $68,000 | -- | |
| Richter Gregory J | $17,600 | -- | |
| State Street Bk & Tr Co Tr For Goldome C | $58,300 | -- | |
| Hobbs Jimmy | $4,000 | -- |
Source: Public Records
Mortgage History
| Date | Status | Borrower | Loan Amount |
|---|---|---|---|
| Previous Owner | Celin Claude | $88,369 |
Source: Public Records
Tax History Compared to Growth
Tax History
| Year | Tax Paid | Tax Assessment Tax Assessment Total Assessment is a certain percentage of the fair market value that is determined by local assessors to be the total taxable value of land and additions on the property. | Land | Improvement |
|---|---|---|---|---|
| 2024 | $1,471 | $38,160 | $5,440 | $32,720 |
| 2023 | $639 | $38,160 | $5,440 | $32,720 |
| 2022 | $1,474 | $38,160 | $5,440 | $32,720 |
| 2021 | $1,264 | $38,160 | $5,440 | $32,720 |
| 2020 | $1,553 | $38,160 | $5,440 | $32,720 |
| 2019 | $1,557 | $38,160 | $5,440 | $32,720 |
| 2018 | $1,561 | $38,160 | $5,440 | $32,720 |
| 2017 | $1,453 | $38,160 | $5,440 | $32,720 |
| 2016 | $1,454 | $38,160 | $5,440 | $32,720 |
| 2015 | $1,456 | $38,160 | $5,440 | $32,720 |
| 2014 | $1,436 | $38,160 | $5,440 | $32,720 |
Source: Public Records
Map
Nearby Homes
- 100 Honeysuckle Dr
- 3402 Radium Springs Rd
- 1508 Liberty Expy SE
- 509 521 Honeysuckle Rd
- 538 Nectar Ln
- 454 Poinciana Ave
- 2417 Cherry Laurel Ln
- 565 Nectar Ln
- 410 Redbud Rd
- 206 Raintree Dr
- 1830 Liberty Expy SE
- 1110 Kreg Ave
- 2803 Spelman Dr
- 2902 Barnaby Dr
- 2910 Barnaby Dr
- 2906 Barnaby Dr
- 2914 Barnaby Dr
- 1224 Nixon Dr
- 4411 Nichols St
- 414 Bush St
- 142 Mockingbird Dr
- 106 Mockingbird Dr
- 108 Mockingbird Dr
- 104 Mockingbird Dr
- 141 Mockingbird Dr
- 110 Mockingbird Dr
- 102 Mockingbird Dr
- 143 Mockingbird Dr
- 112 Mockingbird Dr
- 3100 Radium Springs Rd
- 905 Barbragale Ave
- 907 Barbragale Ave
- 107 Mockingbird Dr
- 3000 Radium Springs Rd
- 109 Mockingbird Dr
- 114 Mockingbird Dr
- 3102 Radium Springs Rd
- 903 Barbragale Ave
- 105 Mockingbird Dr
- 909 Barbragale Ave