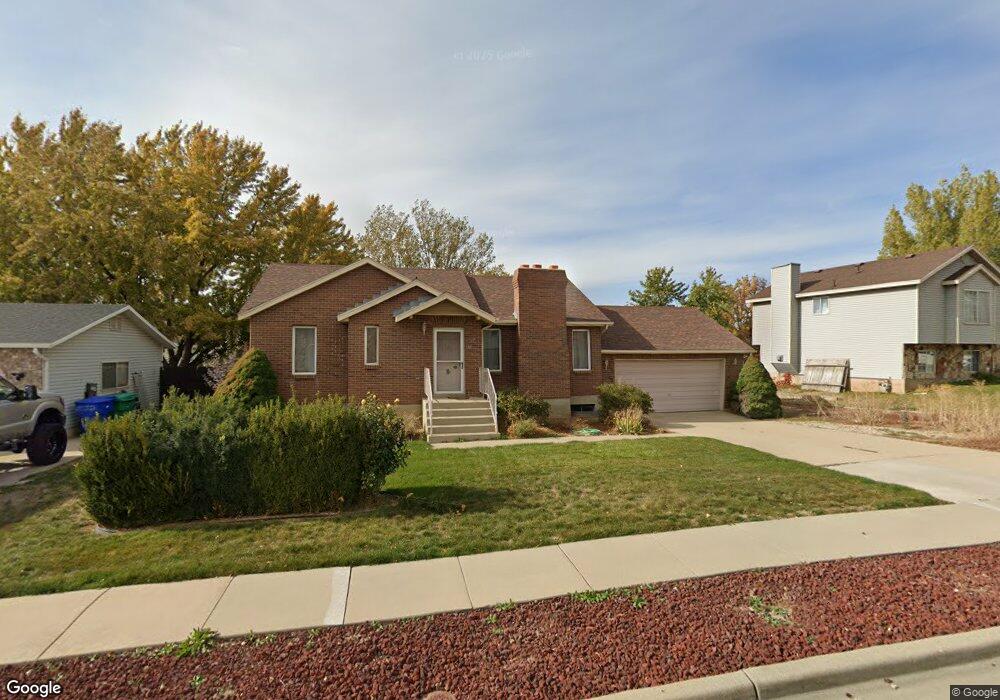
138 N 1525 W Clearfield, UT 84015
Estimated Value: $422,000 - $469,000
4
Beds
3
Baths
1,058
Sq Ft
$426/Sq Ft
Est. Value
About This Home
This home is located at 138 N 1525 W, Clearfield, UT 84015 and is currently estimated at $451,231, approximately $426 per square foot. 138 N 1525 W is a home located in Davis County with nearby schools including Lakeside School, West Point Junior High School, and Syracuse High School.
Ownership History
Date
Name
Owned For
Owner Type
Purchase Details
Closed on
Sep 12, 2007
Sold by
Weber Eldon F and Weber Gina R
Bought by
Weber Eldon F
Current Estimated Value
Home Financials for this Owner
Home Financials are based on the most recent Mortgage that was taken out on this home.
Original Mortgage
$150,000
Outstanding Balance
$95,021
Interest Rate
6.67%
Mortgage Type
New Conventional
Estimated Equity
$356,210
Purchase Details
Closed on
Sep 21, 2005
Sold by
Weber Eldon F
Bought by
Weber Eldon F and Weber Gina R
Home Financials for this Owner
Home Financials are based on the most recent Mortgage that was taken out on this home.
Original Mortgage
$110,231
Interest Rate
5.67%
Mortgage Type
FHA
Purchase Details
Closed on
Oct 28, 1999
Sold by
Weber Gina R
Bought by
Weber Eldon F
Home Financials for this Owner
Home Financials are based on the most recent Mortgage that was taken out on this home.
Original Mortgage
$29,799
Interest Rate
7.75%
Create a Home Valuation Report for This Property
The Home Valuation Report is an in-depth analysis detailing your home's value as well as a comparison with similar homes in the area
Home Values in the Area
Average Home Value in this Area
Purchase History
| Date | Buyer | Sale Price | Title Company |
|---|---|---|---|
| Weber Eldon F | -- | Meridian Title Company | |
| Weber Eldon F | -- | Equity Title Ins Agency Inc | |
| Weber Eldon F | -- | Salt Lake Title & Escrow Co |
Source: Public Records
Mortgage History
| Date | Status | Borrower | Loan Amount |
|---|---|---|---|
| Open | Weber Eldon F | $150,000 | |
| Closed | Weber Eldon F | $110,231 | |
| Closed | Weber Eldon F | $29,799 |
Source: Public Records
Tax History Compared to Growth
Tax History
| Year | Tax Paid | Tax Assessment Tax Assessment Total Assessment is a certain percentage of the fair market value that is determined by local assessors to be the total taxable value of land and additions on the property. | Land | Improvement |
|---|---|---|---|---|
| 2025 | $2,518 | $235,950 | $106,263 | $129,687 |
| 2024 | $2,372 | $223,300 | $95,701 | $127,599 |
| 2023 | $2,206 | $382,000 | $117,303 | $264,697 |
| 2022 | $2,368 | $224,400 | $60,470 | $163,930 |
| 2021 | $2,130 | $302,000 | $96,617 | $205,383 |
| 2020 | $1,858 | $260,000 | $80,774 | $179,226 |
| 2019 | $1,790 | $247,000 | $78,483 | $168,517 |
| 2018 | $1,603 | $218,000 | $79,351 | $138,649 |
| 2016 | $1,372 | $98,175 | $30,665 | $67,510 |
| 2015 | $1,344 | $91,135 | $30,665 | $60,470 |
| 2014 | $1,184 | $81,415 | $30,665 | $50,750 |
| 2013 | -- | $69,104 | $26,884 | $42,220 |
Source: Public Records
Map
Nearby Homes
- 47 N 1750 W
- 135 S 1525 W
- 16 N 1300 W
- 1648 W 150 S
- 575 N 1350 W Unit 137
- 1774 W 400 N
- 1828 W 75 S
- 1350 W 300 N Unit 49
- 1350 W 300 N Unit 38
- 1350 W 300 N Unit 29
- 423 N 1250 W Unit 118
- 1652 W 560 N
- 1337 W 550 N Unit 195
- 563 N 1350 W Unit 139
- 303 N Canterbury Way
- 12 N 2000 W Unit 1
- 417 N 1200 W Unit 84
- 1805 W 675 N
- 607 N 2000 W
- 1832 W 725 N