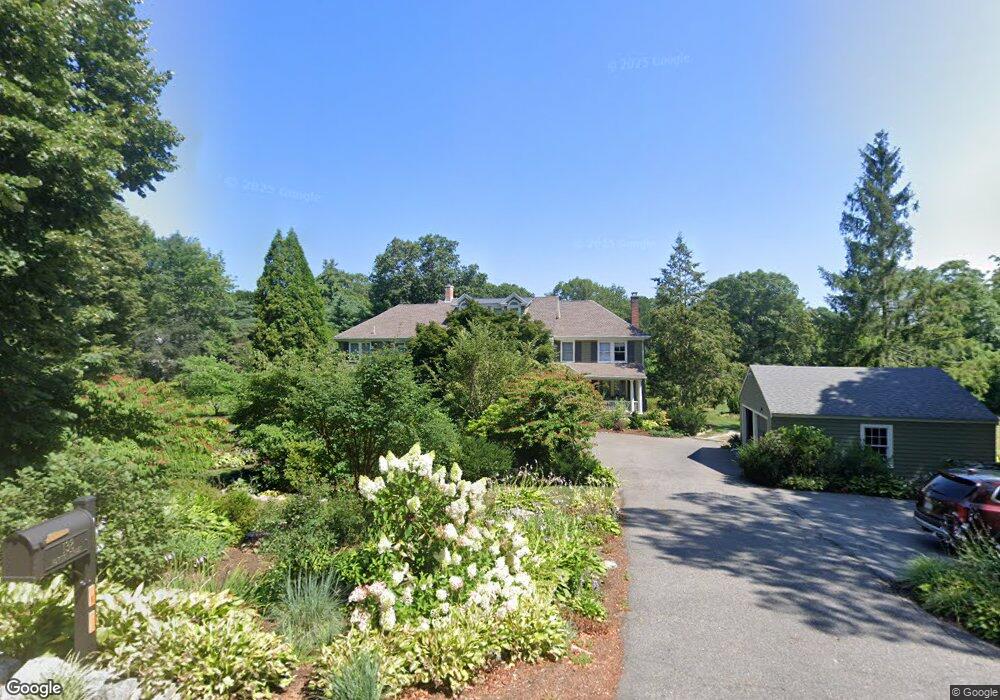
138 Newton St Weston, MA 02493
Estimated Value: $2,448,000 - $3,648,000
5
Beds
4
Baths
4,258
Sq Ft
$718/Sq Ft
Est. Value
About This Home
This home is located at 138 Newton St, Weston, MA 02493 and is currently estimated at $3,058,688, approximately $718 per square foot. 138 Newton St is a home located in Middlesex County with nearby schools including Country Elementary School, Woodland Elementary School, and Weston Middle School.
Ownership History
Date
Name
Owned For
Owner Type
Purchase Details
Closed on
Mar 20, 2013
Sold by
Chapra Steven C and Chapra Cynthia K
Bought by
Steven C Chapra Ret and Chapra Steven C
Current Estimated Value
Purchase Details
Closed on
Jul 17, 2009
Sold by
Reeder Paul A and Reeder Kristen K
Bought by
Chapra Steven C and Chapra Cynthia K
Purchase Details
Closed on
Jan 30, 1995
Sold by
Haigh John A and Haigh Linda S
Bought by
Reeder Paul A and Reeder Kristen K
Purchase Details
Closed on
Apr 11, 1991
Sold by
Davis J H and Davis Connie R
Bought by
Haigh John A and Haigh Linda S
Create a Home Valuation Report for This Property
The Home Valuation Report is an in-depth analysis detailing your home's value as well as a comparison with similar homes in the area
Home Values in the Area
Average Home Value in this Area
Purchase History
| Date | Buyer | Sale Price | Title Company |
|---|---|---|---|
| Steven C Chapra Ret | -- | -- | |
| Chapra Steven C | $1,800,000 | -- | |
| Reeder Paul A | $820,000 | -- | |
| Haigh John A | $635,000 | -- |
Source: Public Records
Mortgage History
| Date | Status | Borrower | Loan Amount |
|---|---|---|---|
| Previous Owner | Haigh John A | $200,000 | |
| Previous Owner | Haigh John A | $200,000 | |
| Previous Owner | Haigh John A | $417,000 |
Source: Public Records
Tax History Compared to Growth
Tax History
| Year | Tax Paid | Tax Assessment Tax Assessment Total Assessment is a certain percentage of the fair market value that is determined by local assessors to be the total taxable value of land and additions on the property. | Land | Improvement |
|---|---|---|---|---|
| 2025 | $24,701 | $2,225,300 | $1,418,800 | $806,500 |
| 2024 | $24,365 | $2,191,100 | $1,418,800 | $772,300 |
| 2023 | $24,916 | $2,104,400 | $1,418,800 | $685,600 |
| 2022 | $24,324 | $1,898,800 | $1,326,000 | $572,800 |
| 2021 | $4,014 | $1,770,300 | $1,274,400 | $495,900 |
| 2020 | $22,240 | $1,733,400 | $1,274,400 | $459,000 |
| 2019 | $21,778 | $1,729,800 | $1,274,400 | $455,400 |
| 2018 | $21,640 | $1,729,800 | $1,274,400 | $455,400 |
| 2017 | $4,110 | $1,728,200 | $1,274,400 | $453,800 |
| 2016 | $21,015 | $1,728,200 | $1,274,400 | $453,800 |
| 2015 | $20,509 | $1,670,100 | $1,228,800 | $441,300 |
Source: Public Records
Map
Nearby Homes